QUESTION IMAGE
Question
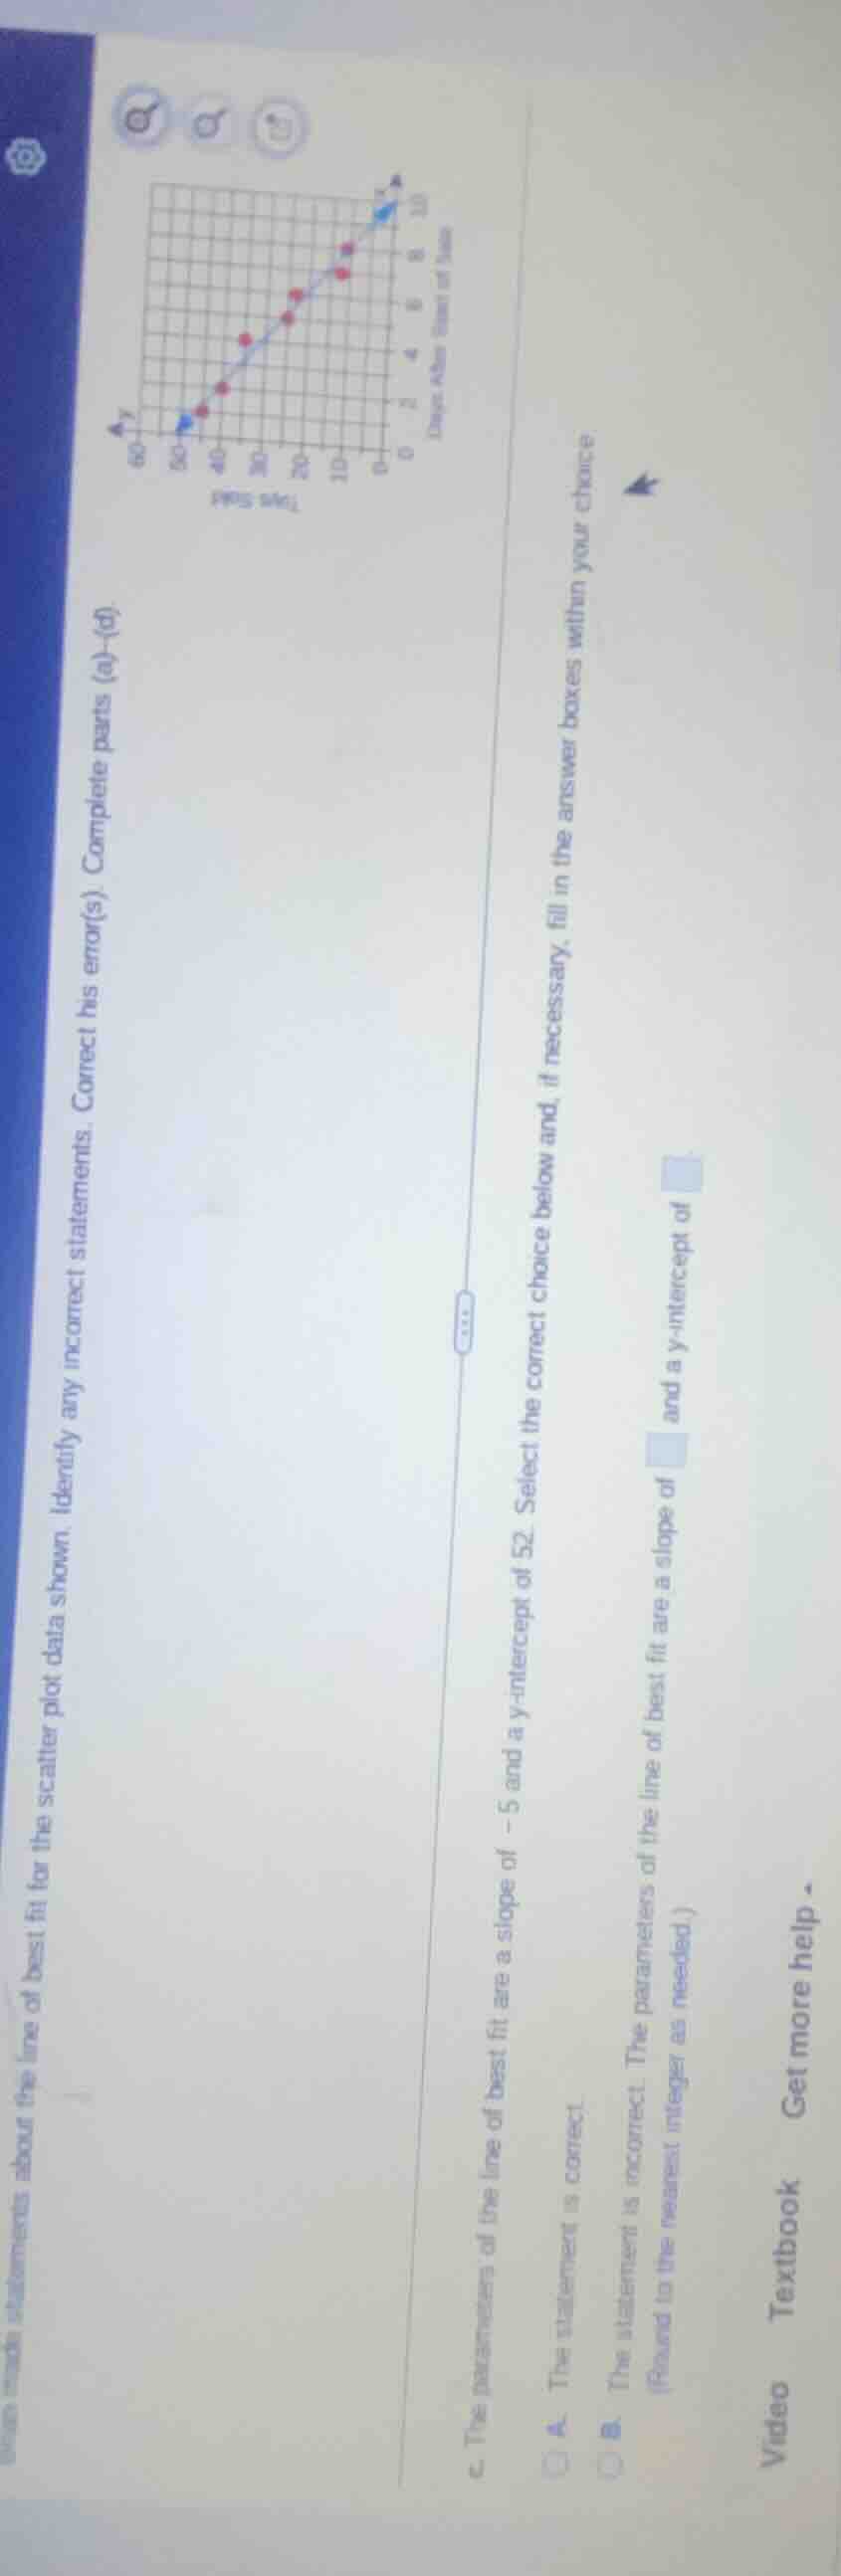
brian made statements about the line of best fit for the scatter plot data shown. identify any incorrect statements. correct his error(s). complete parts (a)-(d).
c. the parameters of the line of best fit are a slope of - 5 and a y-intercept of 52. select the correct choice below and, if necessary, fill in the answer boxes within your choice.
a. the statement is correct.
b. the statement is incorrect. the parameters of the line of best fit are a slope of and a y-intercept of .
(round to the nearest integer as needed.)
video textbook get more help
Step1: Analyze line slope direction
The line of best fit in the scatter plot goes downward from left to right, so the slope is negative. We can calculate the slope using two points on the line, e.g., $(0, 50)$ and $(10, 10)$.
Slope formula: $m=\frac{y_2-y_1}{x_2-x_1}=\frac{10-50}{10-0}=\frac{-40}{10}=-4$
Step2: Identify y-intercept
The y-intercept is the y-value where the line crosses the y-axis, which is at $x=0$. From the line, this value is 50.
Step3: Evaluate the given statement
The given slope is -5 and y-intercept 52, which does not match our calculated values.

Snap & solve any problem in the app
Get step-by-step solutions on Sovi AI
Photo-based solutions with guided steps
Explore more problems and detailed explanations
B. The statement is incorrect. The parameters of the line of best fit are a slope of $\boldsymbol{-4}$ and a y-intercept of $\boldsymbol{50}$.