QUESTION IMAGE
Question
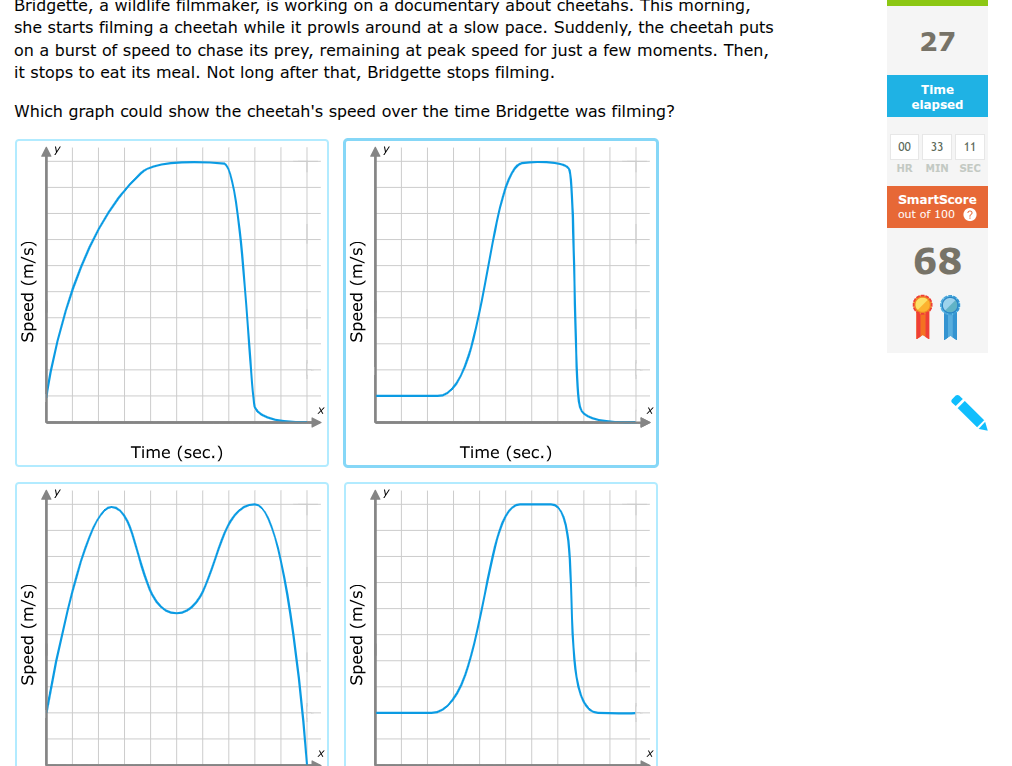
bridgette, a wildlife filmmaker, is working on a documentary about cheetahs. this morning, she starts filming a cheetah while it prowls around at a slow pace. suddenly, the cheetah puts on a burst of speed to chase its prey, remaining at peak speed for just a few moments. then, it stops to eat its meal. not long after that, bridgette stops filming.
which graph could show the cheetahs speed over the time bridgette was filming?
Step1: Analyze the Cheetah's Speed Phases
The cheetah starts at a slow, constant speed (so initial speed is a non - zero constant, horizontal line), then has a burst of speed (increasing speed), then peak speed (constant, horizontal line), then stops to eat (speed drops to near zero quickly), and then after eating, since Bridgette stops filming not long after, we don't have a long period after. Let's analyze each graph:
- First graph: Initial speed is increasing from a non - zero value, not a slow constant speed. So eliminate.
- Second graph: Initial speed is constant (slow pace), then speed increases (burst to chase), then constant peak speed, then speed drops quickly (stops to eat), and then a small tail (not long after, Bridgette stops filming). This matches.
- Third graph: Has two peaks and a dip, which doesn't match the cheetah's behavior (only one chase and then eating). Eliminate.
- Fourth graph: After the speed drops, it goes back to a constant speed, but the cheetah stops to eat, so after eating, we don't have a long constant speed period (Bridgette stops filming not long after). Eliminate.

Snap & solve any problem in the app
Get step-by-step solutions on Sovi AI
Photo-based solutions with guided steps
Explore more problems and detailed explanations
The second graph (the one in the top - right among the four graphs, with initial constant speed, then increase, then constant peak, then quick drop)