QUESTION IMAGE
Question
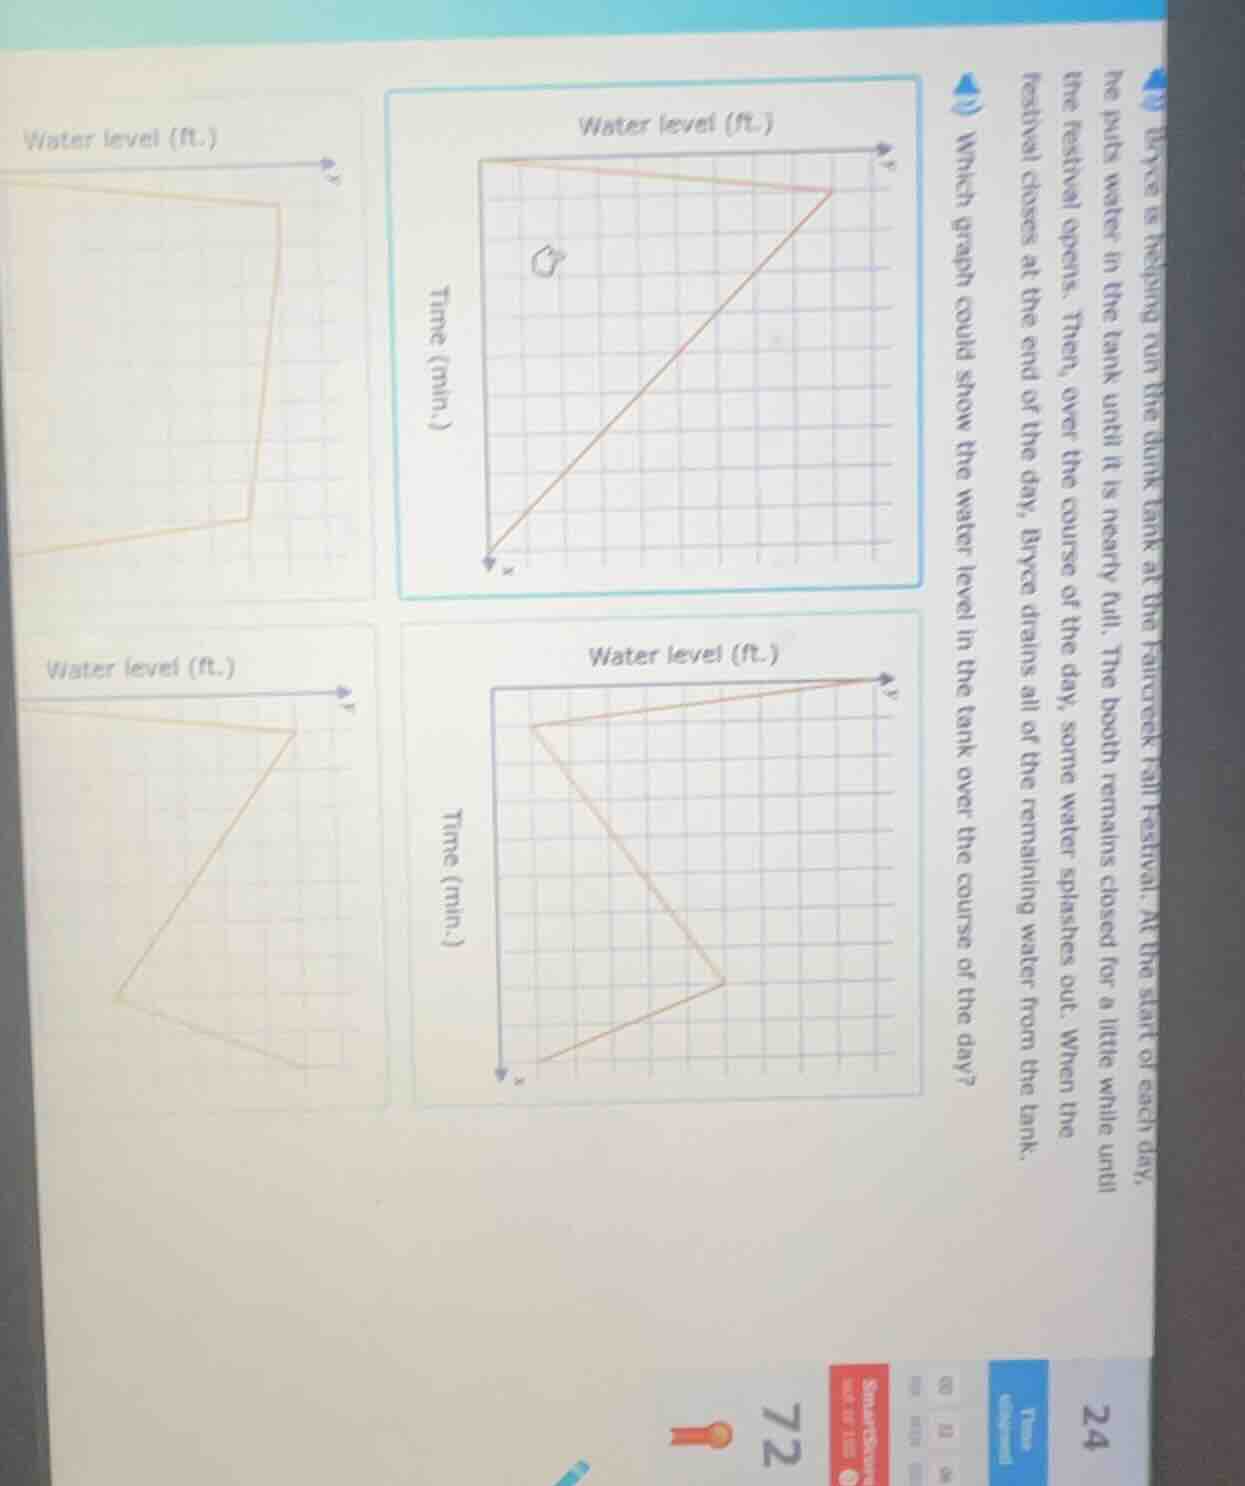
bryce is helping run the dunk tank at the hancock fall festival. at the start of each day, he puts water in the tank until it is nearly full. the booth remains closed for a little while until the festival opens. then, over the course of the day, some water splashes out. when the festival closes at the end of the day, bryce drains all of the remaining water from the tank. which graph could show the water level in the tank over the course of the day?
- Phase 1: Bryce fills the tank to nearly full, so water level (y-axis) rises quickly to a high value as time (x-axis) passes.
- Phase 2: The booth is closed, so water level stays constant (flat horizontal line) for some time.
- Phase 3: Some water splashes out, so water level drops a small amount quickly, then stays constant again during the festival.
- Phase 4: At the end of the day, all water is drained, so water level drops to 0 quickly.
The bottom-right graph matches all these stages: a sharp rise to a high level, a flat period, a small sharp drop, another flat period, and finally a sharp drop to 0.

Snap & solve any problem in the app
Get step-by-step solutions on Sovi AI
Photo-based solutions with guided steps
Explore more problems and detailed explanations
The bottom-right graph (with a sharp upward slope, flat segment, small downward slope, flat segment, then sharp downward slope to the x-axis)