QUESTION IMAGE
Question
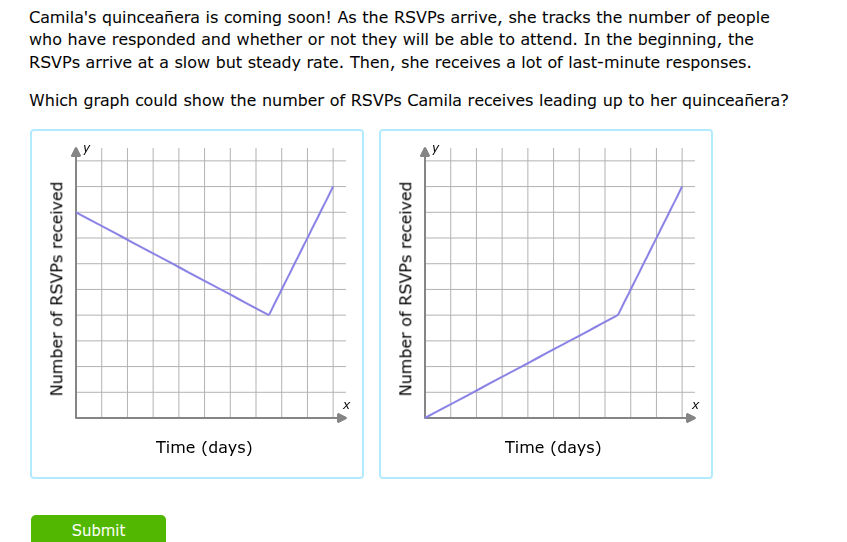
camilas quinceañera is coming soon! as the rsvps arrive, she tracks the number of people who have responded and whether or not they will be able to attend. in the beginning, the rsvps arrive at a slow but steady rate. then, she receives a lot of last - minute responses. which graph could show the number of rsvps camila receives leading up to her quinceañera?
Brief Explanations
- The number of RSVPs can never decrease (people don't un-RSVP in this context), so the left graph with a downward slope is invalid.
- The right graph matches the description: first, a slow, steady upward slope (slow but steady early RSVPs), followed by a steep upward slope (many last-minute responses), with the total number of RSVPs always increasing over time.

Snap & solve any problem in the app
Get step-by-step solutions on Sovi AI
Photo-based solutions with guided steps
Explore more problems and detailed explanations
The graph on the right (starting low, increasing slowly then steeply)