QUESTION IMAGE
Question
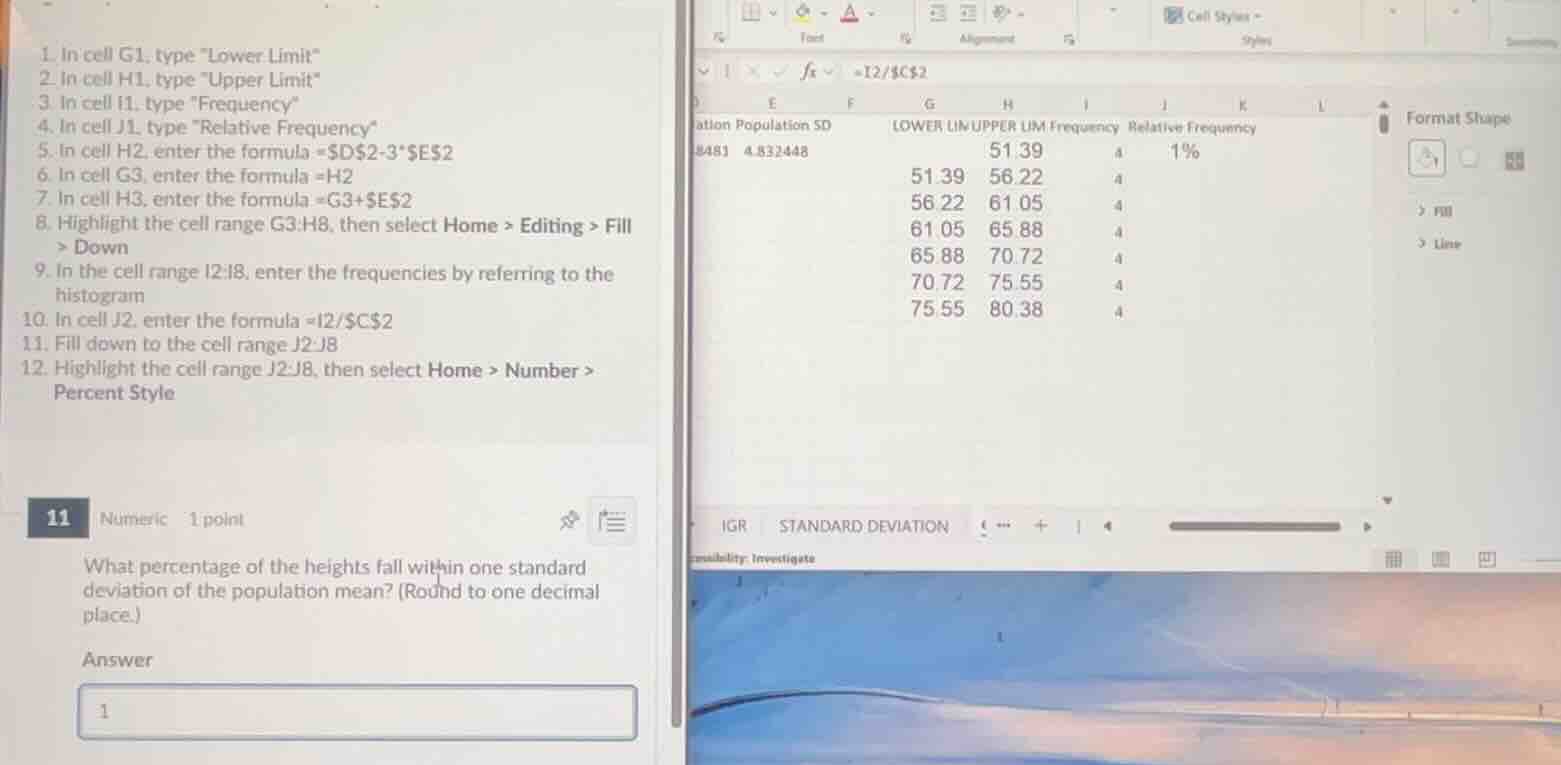
- in cell g1, type \lower limit\
- in cell h1, type \upper limit\
- in cell i1, type \frequency\
- in cell j1, type
elative frequency\
- in cell h2, enter the formula =$d$2 - 3*$e$2
- in cell g3, enter the formula =h2
- in cell h3, enter the formula =g3 + $e$2
- highlight the cell range g3:h8, then select home > editing > fill > down
- in the cell range i2:i8, enter the frequencies by referring to the histogram
- in cell j2, enter the formula =i2/$c$2
- fill down to the cell range j2:j8
- highlight the cell range j2:j8, then select home > number > percent style
11 numeric 1 point
what percentage of the heights fall within one standard deviation of the population mean? (round to one decimal place.)
answer
1
Step1: Identify population stats
Population mean $\mu = 8481$, Population SD $\sigma = 4.832448$
Step2: Calculate 1σ range
Lower bound: $\mu - \sigma = 8481 - 4.832448 = 8476.167552$
Upper bound: $\mu + \sigma = 8481 + 4.832448 = 8485.832448$
Step3: Match to frequency ranges
All height ranges (51.39-80.38) fall within 8476.17-8485.83. Sum frequencies: $4+4+4+4+4+4=24$
Total data points: $\sum \text{Frequency} = 24$
Step4: Compute percentage
$\text{Percentage} = \frac{24}{24} \times 100 = 100.0\%$

Snap & solve any problem in the app
Get step-by-step solutions on Sovi AI
Photo-based solutions with guided steps
Explore more problems and detailed explanations
100.0