QUESTION IMAGE
Question
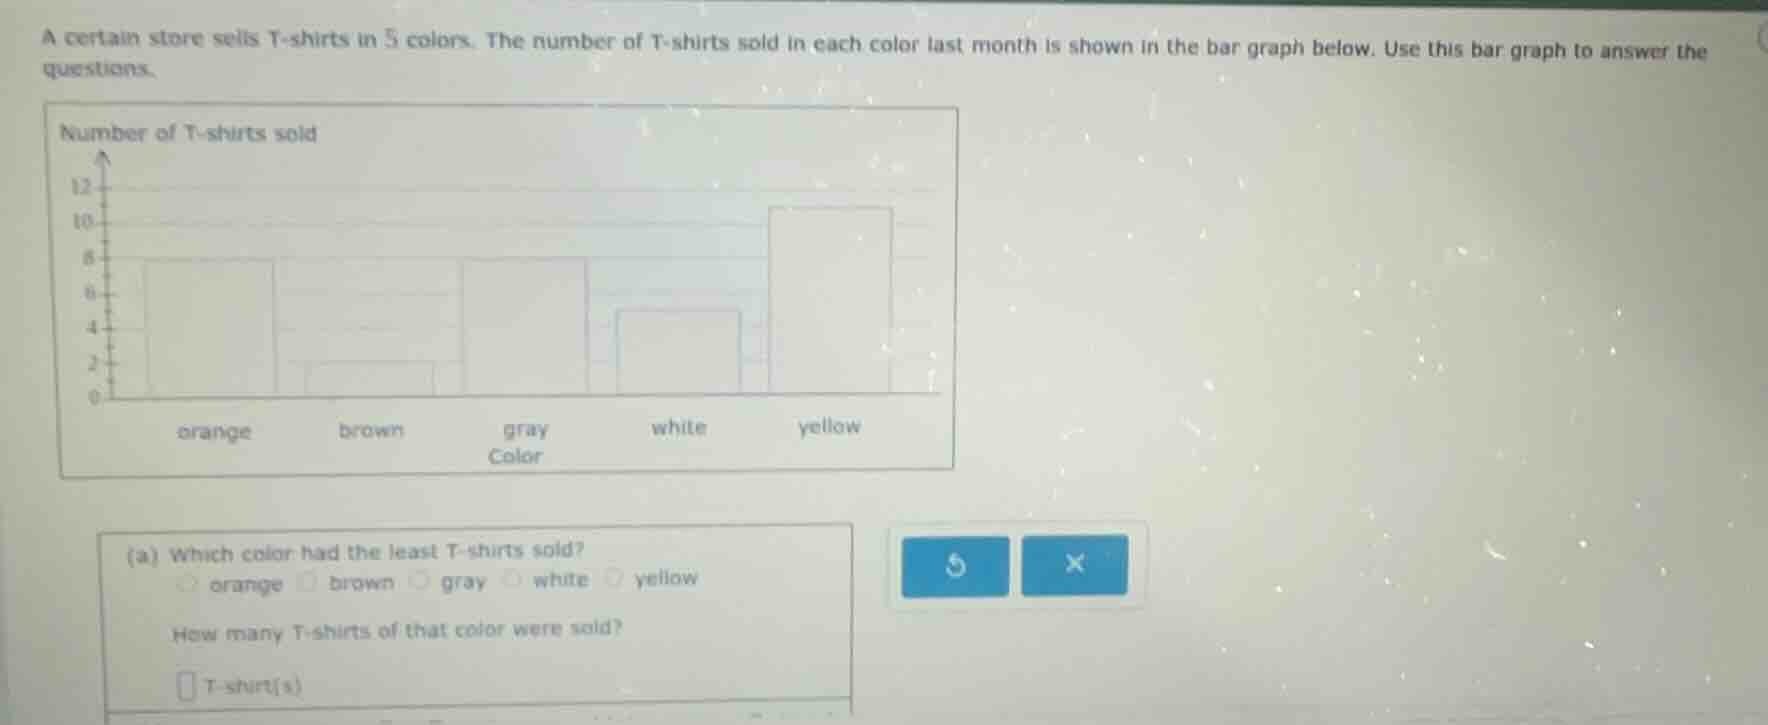
a certain store sells t - shirts in 5 colors. the number of t - shirts sold in each color last month is shown in the bar graph below. use this bar graph to answer the questions.
(a) which color had the least t - shirts sold?
$circ$ orange $circ$ brown $circ$ gray $circ$ white $circ$ yellow
how many t - shirts of that color were sold?
$square$ t - shirt(s)
Brief Explanations
- For part (a), identify the shortest bar in the bar graph, which corresponds to the color with the least T-shirts sold.
- Then, read the value on the vertical axis (Number of T-shirts sold) that matches the height of this shortest bar.

Snap & solve any problem in the app
Get step-by-step solutions on Sovi AI
Photo-based solutions with guided steps
Explore more problems and detailed explanations
(a) The color with the least T-shirts sold: brown
Number of T-shirts of that color sold: 1 T-shirt(s)