QUESTION IMAGE
Question
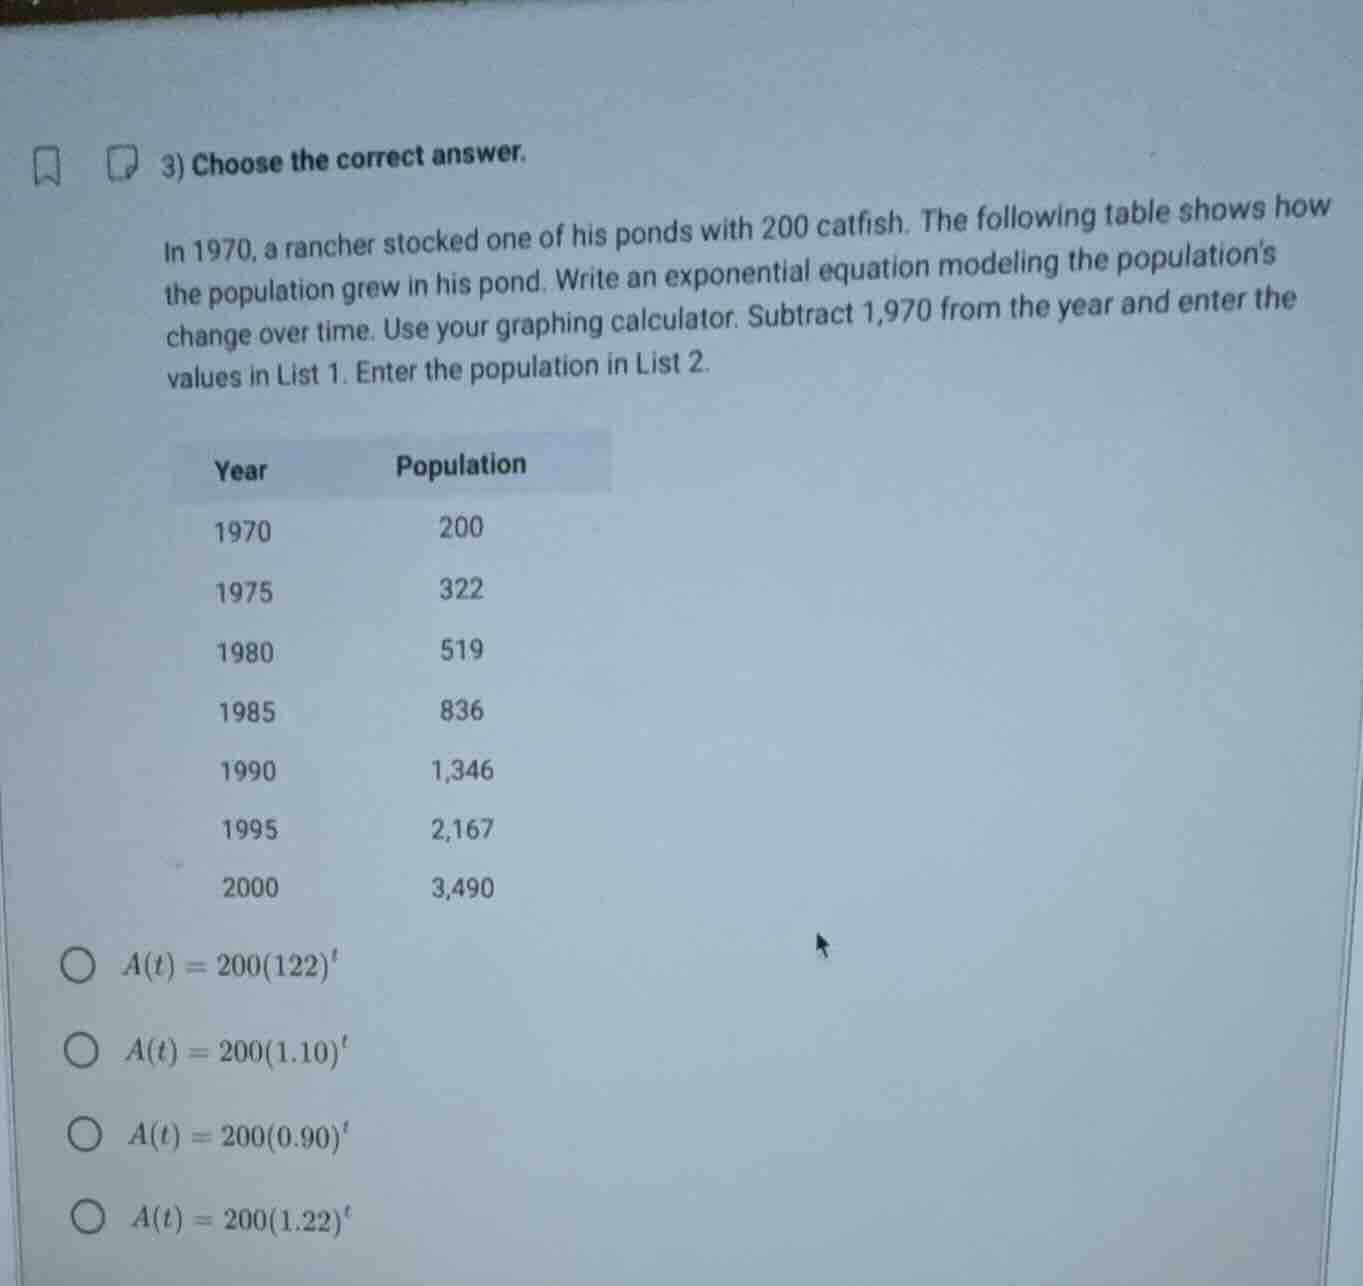
- choose the correct answer.
in 1970, a rancher stocked one of his ponds with 200 catfish. the following table shows how the population grew in his pond. write an exponential equation modeling the populations change over time. use your graphing calculator. subtract 1,970 from the year and enter the values in list 1. enter the population in list 2.
| year | population |
|---|---|
| 1975 | 322 |
| 1980 | 519 |
| 1985 | 836 |
| 1990 | 1,346 |
| 1995 | 2,167 |
| 2000 | 3,490 |
- $a(t) = 200(122)^t$
- $a(t) = 200(1.10)^t$
- $a(t) = 200(0.90)^t$
- $a(t) = 200(1.22)^t$
Step1: Define time variable $t$
Let $t$ = year - 1970, so $t=0,5,10,...,30$ for the given years.
Step2: Recall exponential model form
The standard exponential growth model is $A(t)=A_0(b)^t$, where $A_0=200$ (initial population at $t=0$).
Step3: Test growth factor $b$
Use $t=5$, $A(5)=322$. Substitute into model:
$$322=200(b)^5$$
Solve for $b$:
$$b=\sqrt[5]{\frac{322}{200}}=\sqrt[5]{1.61}\approx1.10$$
Verify with $t=10$: $A(10)=200(1.10)^{10}\approx200\times2.5937\approx518.74$, which matches the given 519.

Snap & solve any problem in the app
Get step-by-step solutions on Sovi AI
Photo-based solutions with guided steps
Explore more problems and detailed explanations
B. $A(t) = 200(1.10)^t$