QUESTION IMAGE
Question
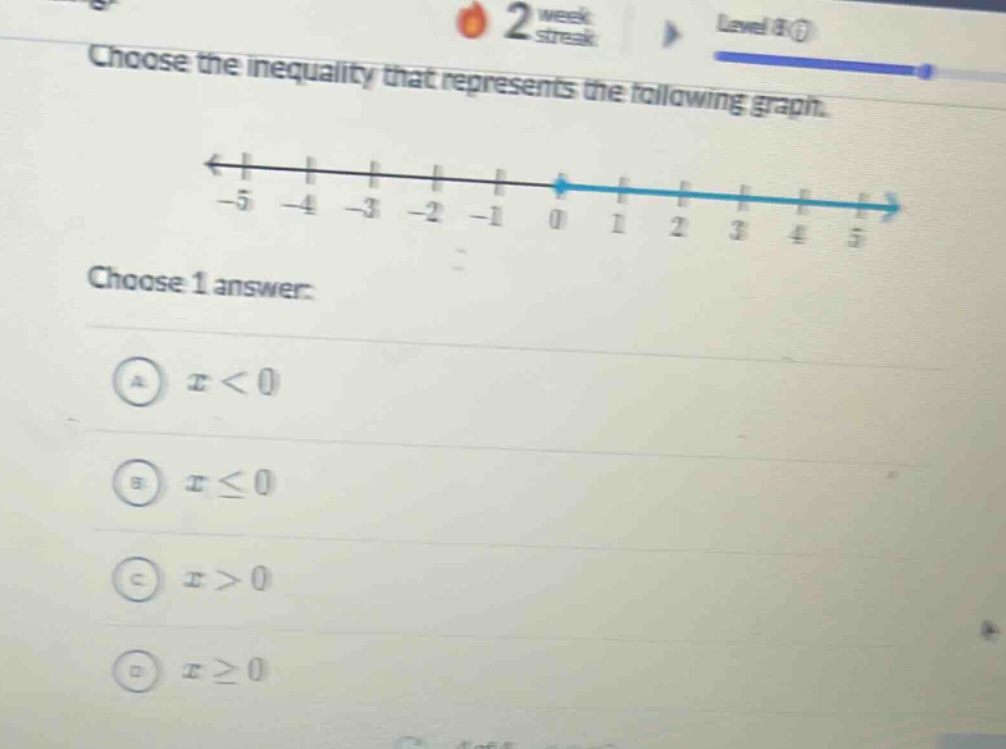
choose the inequality that represents the following graph.
choose 1 answer:
a ( x < 0 )
b ( x leq 0 )
c ( x > 0 )
d ( x geq 0 )
Brief Explanations
To determine the inequality from the number - line graph:
- First, observe the point on the number - line. The dot at 0 is a closed (filled - in) dot. A closed dot on a number - line graph for an inequality means that the value at that point (0 in this case) is included in the solution set.
- Then, observe the direction of the arrow. The arrow is pointing to the right, which means that we are including all numbers greater than or equal to 0.
- For option A ($x < 0$), the graph would have an open dot at 0 and an arrow to the left, so it is incorrect.
- For option B ($x\leq0$), the graph would have a closed dot at 0 and an arrow to the left, so it is incorrect.
- For option C ($x > 0$), the graph would have an open dot at 0 and an arrow to the right, so it is incorrect.
- For option D ($x\geq0$), it has a closed dot at 0 (indicating that 0 is included) and an arrow to the right (indicating numbers greater than 0 are included), which matches the given graph.

Snap & solve any problem in the app
Get step-by-step solutions on Sovi AI
Photo-based solutions with guided steps
Explore more problems and detailed explanations
D. $x\geq0$