QUESTION IMAGE
Question
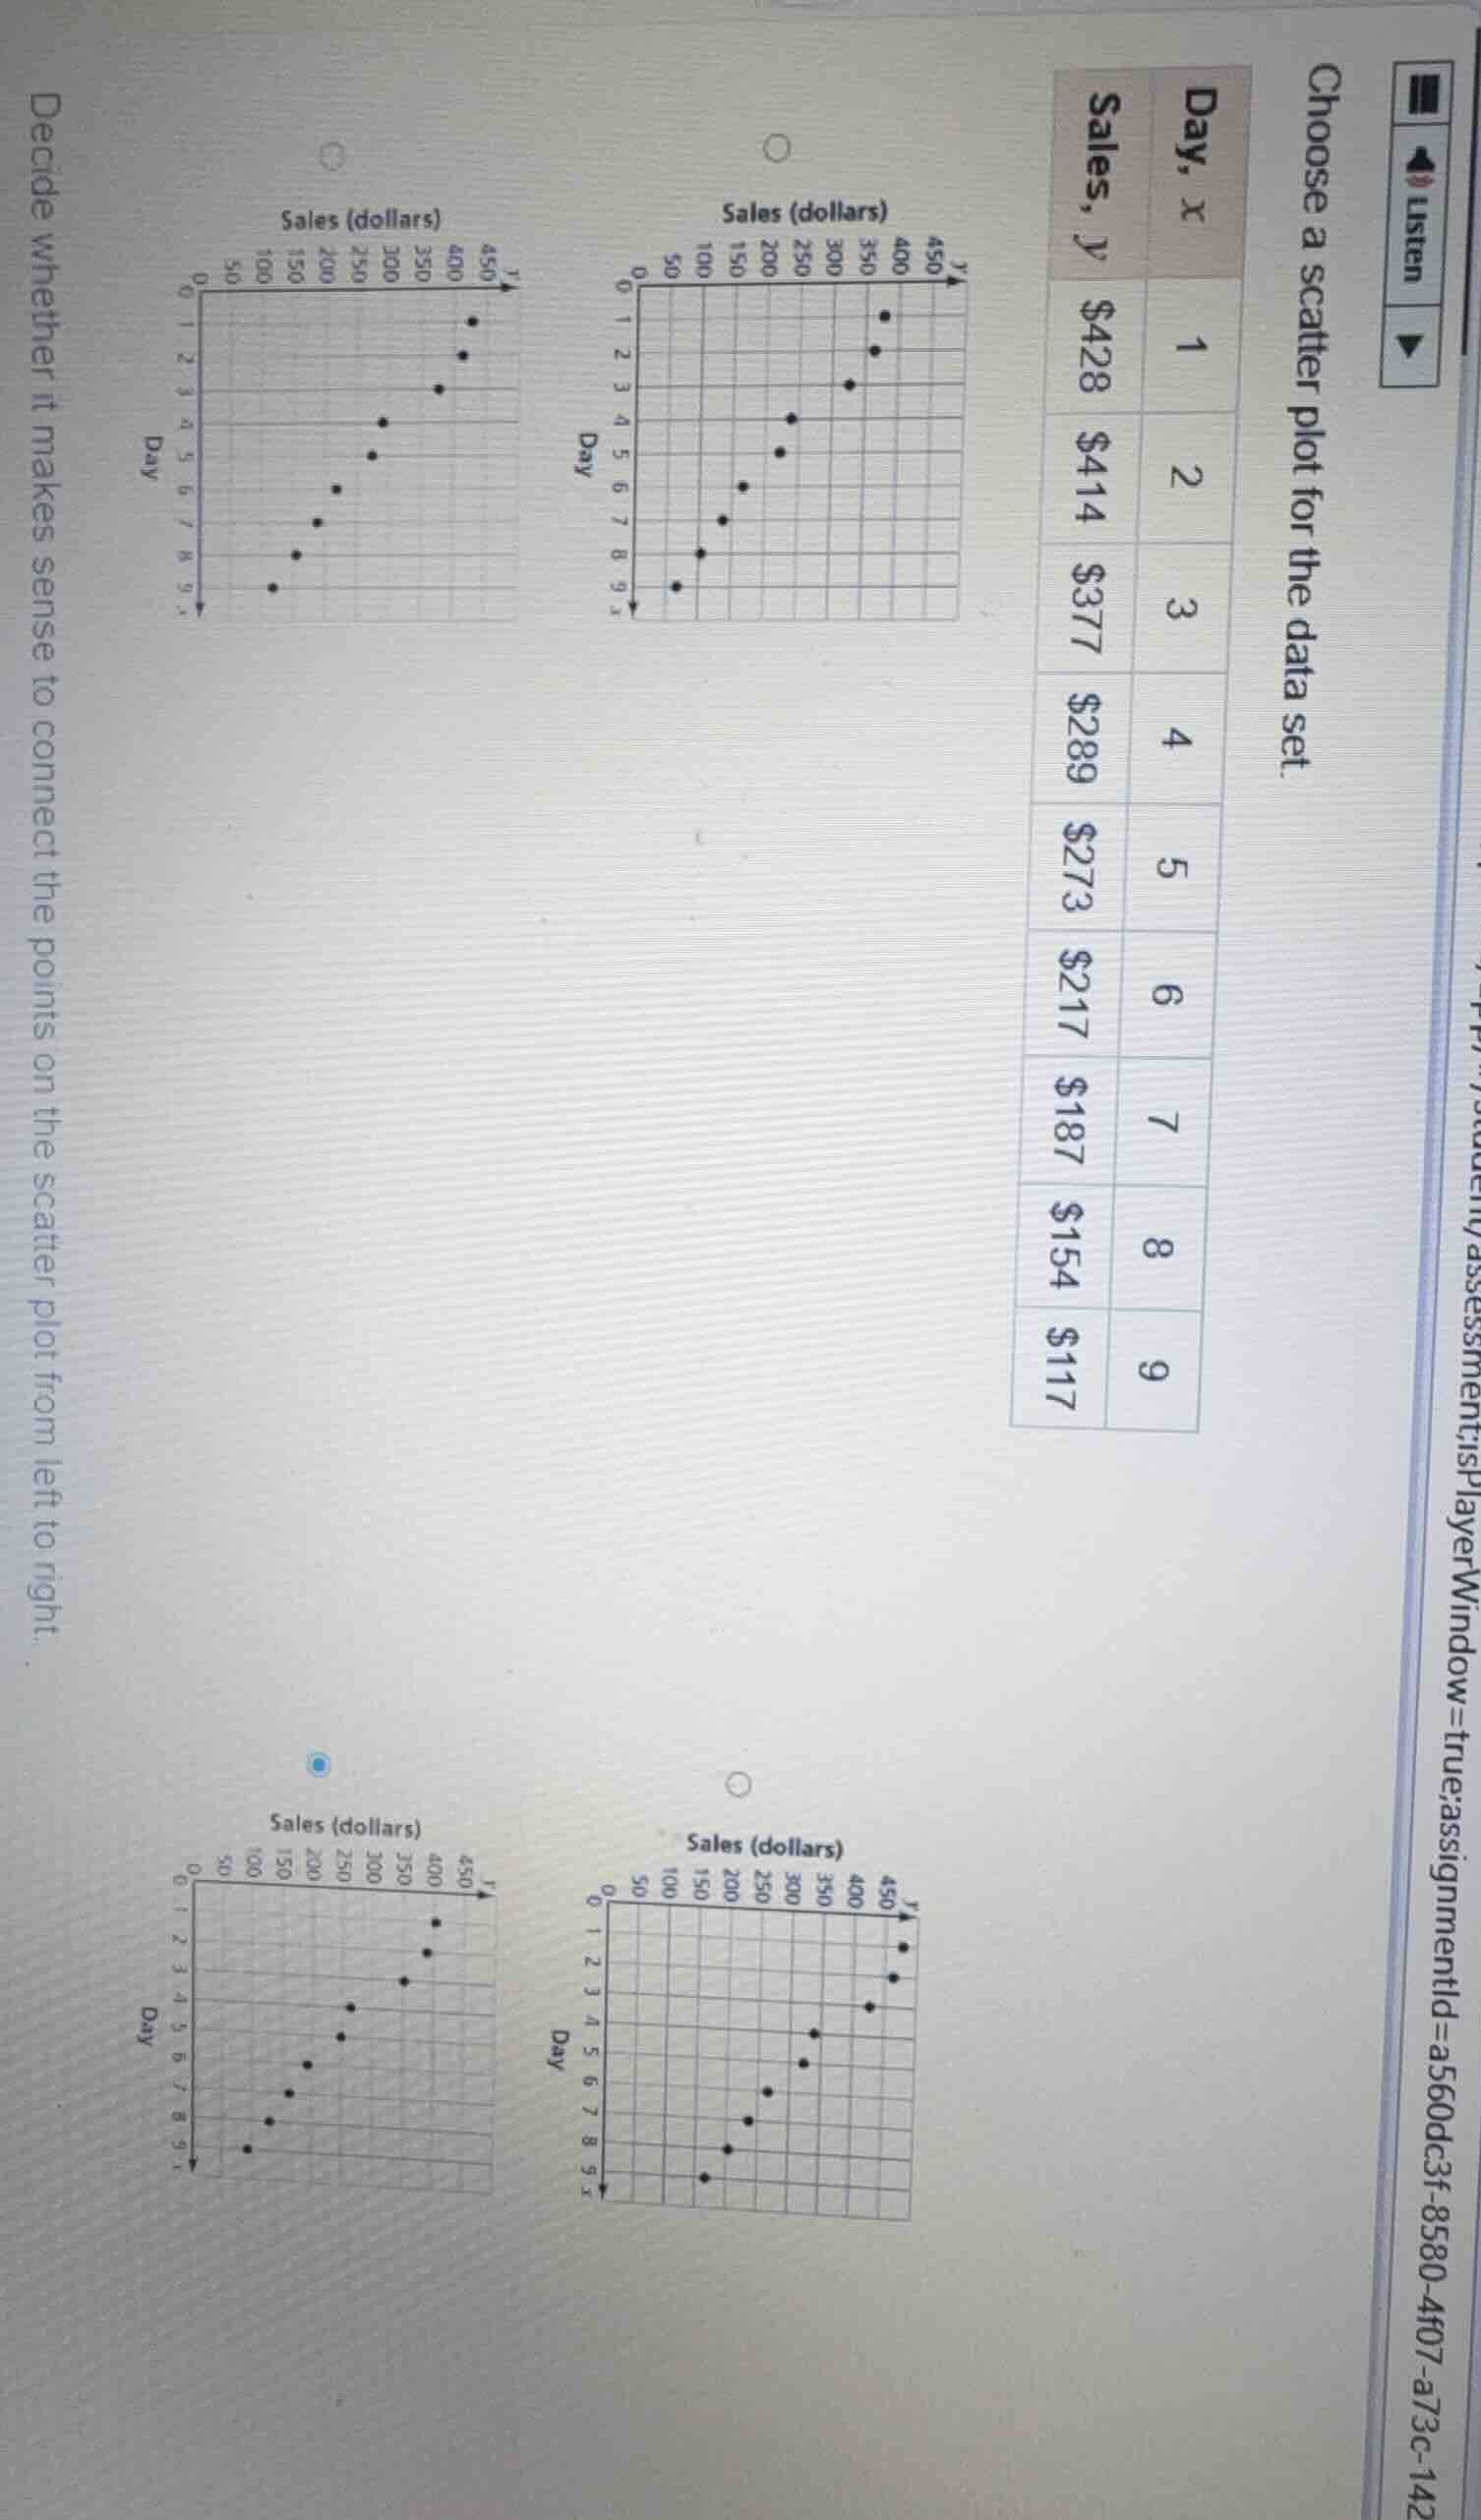
choose a scatter plot for the data set.
day, x | sales, y
1 | $428
2 | $414
3 | $377
4 | $289
5 | $273
6 | $217
7 | $187
8 | $154
9 | $117
decide whether it makes sense to connect the points on the scatter plot from left to right.
Step1: Match data to coordinates
Each pair is $(x,y)$: $(1,428), (2,414), (3,377), (4,289), (5,273), (6,217), (7,187), (8,154), (9,117)$
Step2: Verify scatter plot points
Check which plot has Day (x-axis) matching Sales (y-axis):
- Day 1: $y=428$ (top-left of plot)
- Day 9: $y=117$ (bottom-right of plot)
The top-left scatter plot matches these values.
Step3: Evaluate connecting points
Days are ordered, sales change continuously over time, so connecting points shows the trend between consecutive days, which is meaningful.

Snap & solve any problem in the app
Get step-by-step solutions on Sovi AI
Photo-based solutions with guided steps
Explore more problems and detailed explanations
- The correct scatter plot is the top-left plot (with points starting at $(1, 428)$ and decreasing to $(9, 117)$).
- Yes, it makes sense to connect the points from left to right, as the days are sequential and connecting them clearly shows the downward trend in sales over time.