QUESTION IMAGE
Question
classifying data distributions
the probabil dropdown viewed.
the mean is dropdown with options: greater than the median, less than the median, equal to the median
the mode is dropdown
To analyze the data distribution:
Step 1: Identify the Distribution Shape
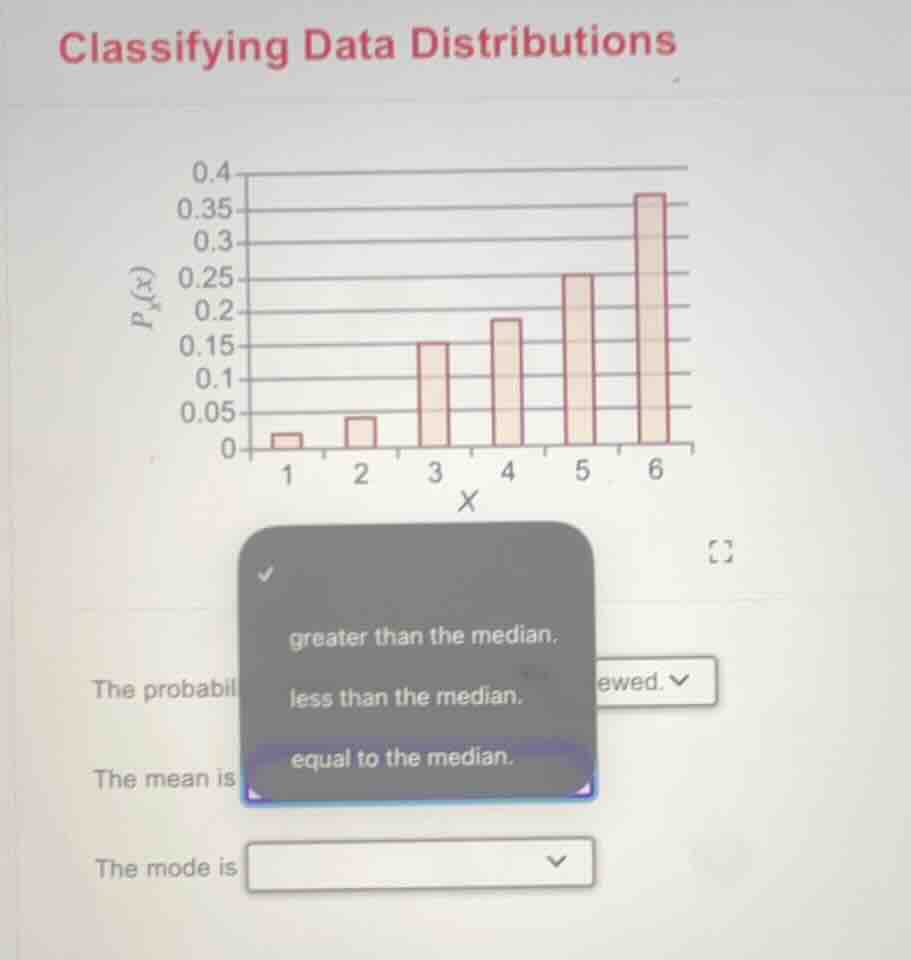
The bar graph (probability distribution) shows values of \( x \) (1, 2, 3, 4, 5, 6) with probabilities \( P(x) \). The heights of the bars increase from \( x=1 \) to \( x=6 \), meaning the distribution is left - skewed (or negatively skewed). In a left - skewed distribution, the mean is pulled toward the tail (left side), while the median is a middle - position measure, and the mode is the most frequent value (highest bar).
Step 2: Analyze Mean vs. Median in Left - Skewed Distributions
In a left - skewed distribution, the mean is less than the median. This is because the left - tail (lower \( x \) values) has relatively low probabilities but still pulls the mean down. The median is the middle value when the data is ordered, and it is less affected by the skewed tail.
Step 3: Analyze Mode
The mode is the \( x \) - value with the highest probability (tallest bar). Here, the tallest bar is at \( x = 6 \), so the mode is 6.
Final Answers
- The mean is less than the median.
- The mode is 6.
(For the dropdown about the mean - median relationship, select "less than the median"; for the mode dropdown, select 6.)

Snap & solve any problem in the app
Get step-by-step solutions on Sovi AI
Photo-based solutions with guided steps
Explore more problems and detailed explanations
To analyze the data distribution:
Step 1: Identify the Distribution Shape
The bar graph (probability distribution) shows values of \( x \) (1, 2, 3, 4, 5, 6) with probabilities \( P(x) \). The heights of the bars increase from \( x=1 \) to \( x=6 \), meaning the distribution is left - skewed (or negatively skewed). In a left - skewed distribution, the mean is pulled toward the tail (left side), while the median is a middle - position measure, and the mode is the most frequent value (highest bar).
Step 2: Analyze Mean vs. Median in Left - Skewed Distributions
In a left - skewed distribution, the mean is less than the median. This is because the left - tail (lower \( x \) values) has relatively low probabilities but still pulls the mean down. The median is the middle value when the data is ordered, and it is less affected by the skewed tail.
Step 3: Analyze Mode
The mode is the \( x \) - value with the highest probability (tallest bar). Here, the tallest bar is at \( x = 6 \), so the mode is 6.
Final Answers
- The mean is less than the median.
- The mode is 6.
(For the dropdown about the mean - median relationship, select "less than the median"; for the mode dropdown, select 6.)