QUESTION IMAGE
Question
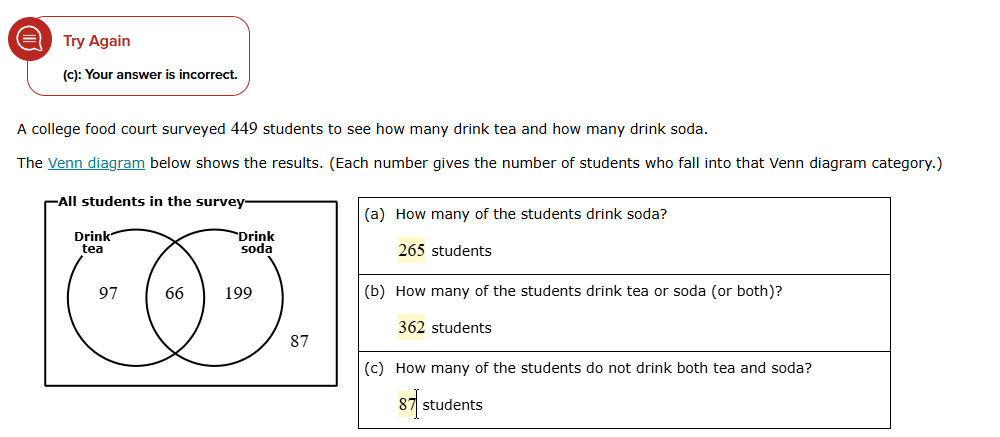
a college food court surveyed 449 students to see how many drink tea and how many drink soda. the venn diagram below shows the results. (each number gives the number of students who fall into that venn diagram category.) (a) how many of the students drink soda? 265 students (b) how many of the students drink tea or soda (or both)? 362 students (c) how many of the students do not drink both tea and soda? 87 students
Step1: Identify target group
The students who do not drink both tea and soda are the ones outside both circles in the Venn diagram.
Step2: Extract the value
From the Venn diagram, the number of students in this group is given as 87.

Snap & solve any problem in the app
Get step-by-step solutions on Sovi AI
Photo-based solutions with guided steps
Explore more problems and detailed explanations
87 students