QUESTION IMAGE
Question
common core algebra i b-cr
engli
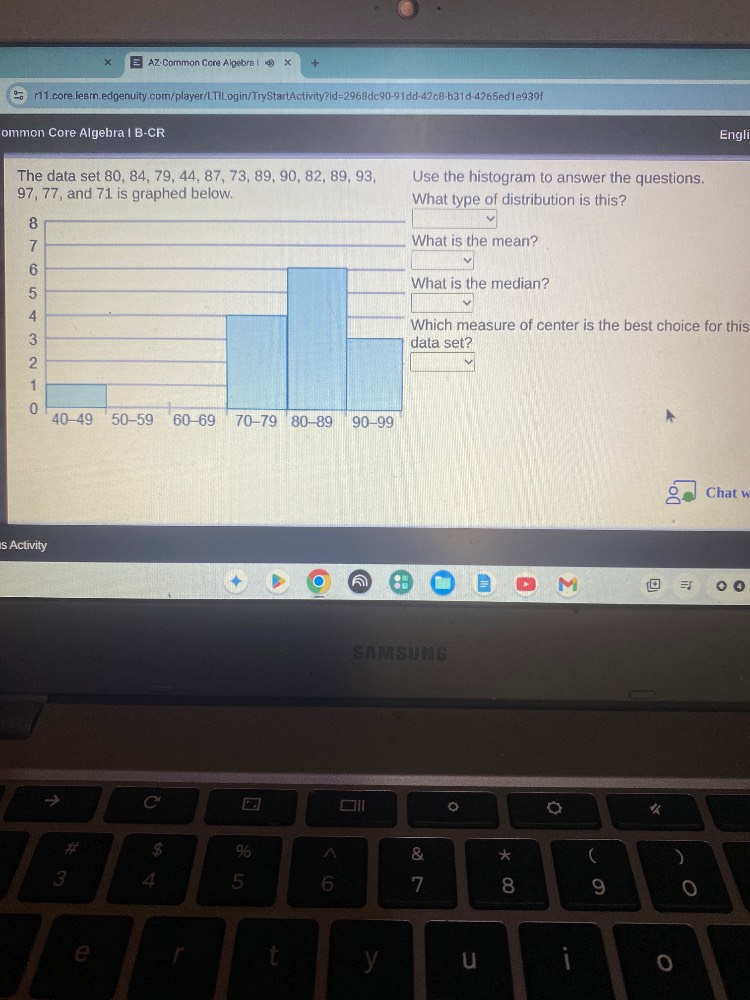
the data set 80, 84, 79, 44, 87, 73, 89, 90, 82, 89, 93, 97, 77, and 71 is graphed below.
use the histogram to answer the questions.
what type of distribution is this?
what is the mean?
what is the median?
which measure of center is the best choice for this data set?
Step1: Identify distribution type
The histogram has the highest bar in the middle, with shorter bars symmetrically on either side, so it is a symmetric (approximately normal) distribution.
Step2: Calculate the mean
Sum all data points: $80 + 84 + 79 + 44 + 87 + 73 + 89 + 90 + 82 + 89 + 93 + 97 + 77 + 71 = 1135$
Divide by the number of data points ($n=14$):
$\text{Mean} = \frac{1135}{14} \approx 81.07$
Step3: Calculate the median
First, order the data: $44, 71, 73, 77, 79, 80, 82, 84, 87, 89, 89, 90, 93, 97$
For even $n$, average the 7th and 8th values:
$\text{Median} = \frac{82 + 84}{2} = 83$
Step4: Choose best center measure
For symmetric distributions, mean and median are close, but mean is typically preferred as it uses all data points.

Snap & solve any problem in the app
Get step-by-step solutions on Sovi AI
Photo-based solutions with guided steps
Explore more problems and detailed explanations
What type of distribution is this? Symmetric (approximately normal) distribution
What is the mean? $\approx 81.07$
What is the median? $83$
Which measure of center is the best choice for this data set? Mean