QUESTION IMAGE
Question
common core algebra i b-cr
english
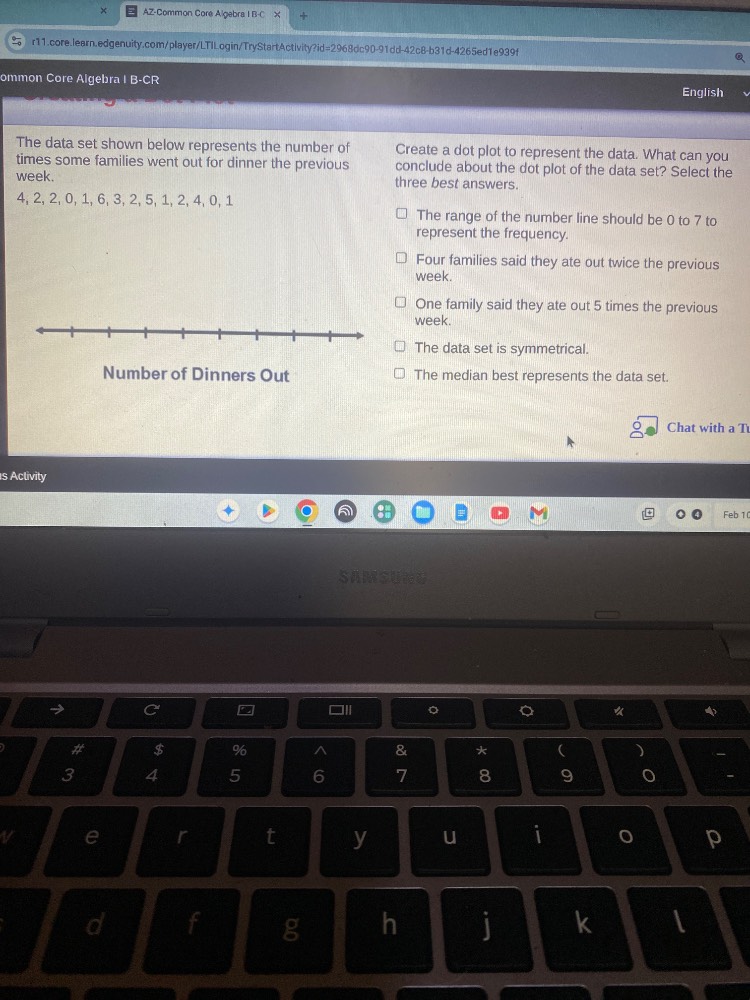
the data set shown below represents the number of times some families went out for dinner the previous week.
4, 2, 2, 0, 1, 6, 3, 2, 5, 1, 2, 4, 0, 1
number of dinners out
create a dot plot to represent the data. what can you conclude about the dot plot of the data set? select the three best answers.
□ the range of the number line should be 0 to 7 to represent the frequency.
□ four families said they ate out twice the previous week.
□ one family said they ate out 5 times the previous week.
□ the data set is symmetrical.
□ the median best represents the data set.
Step1: Organize data in order
Sorted data: $0, 0, 1, 1, 1, 2, 2, 2, 2, 3, 4, 4, 5, 6$
Step2: Verify each option
- Range check: Min=0, Max=6 → number line 0-7 works.
- Count 2s: 4 entries → matches.
- Count 5s: 1 entry → matches.
- Symmetry check: Data is right-skewed → not symmetrical.
- Central tendency: Skewed data uses median → valid.
Step3: Select top 3 valid options
Choose the three correct conclusions.

Snap & solve any problem in the app
Get step-by-step solutions on Sovi AI
Photo-based solutions with guided steps
Explore more problems and detailed explanations
- The range of the number line should be 0 to 7 to represent the frequency.
- Four families said they ate out twice the previous week.
- The median best represents the data set.