QUESTION IMAGE
Question
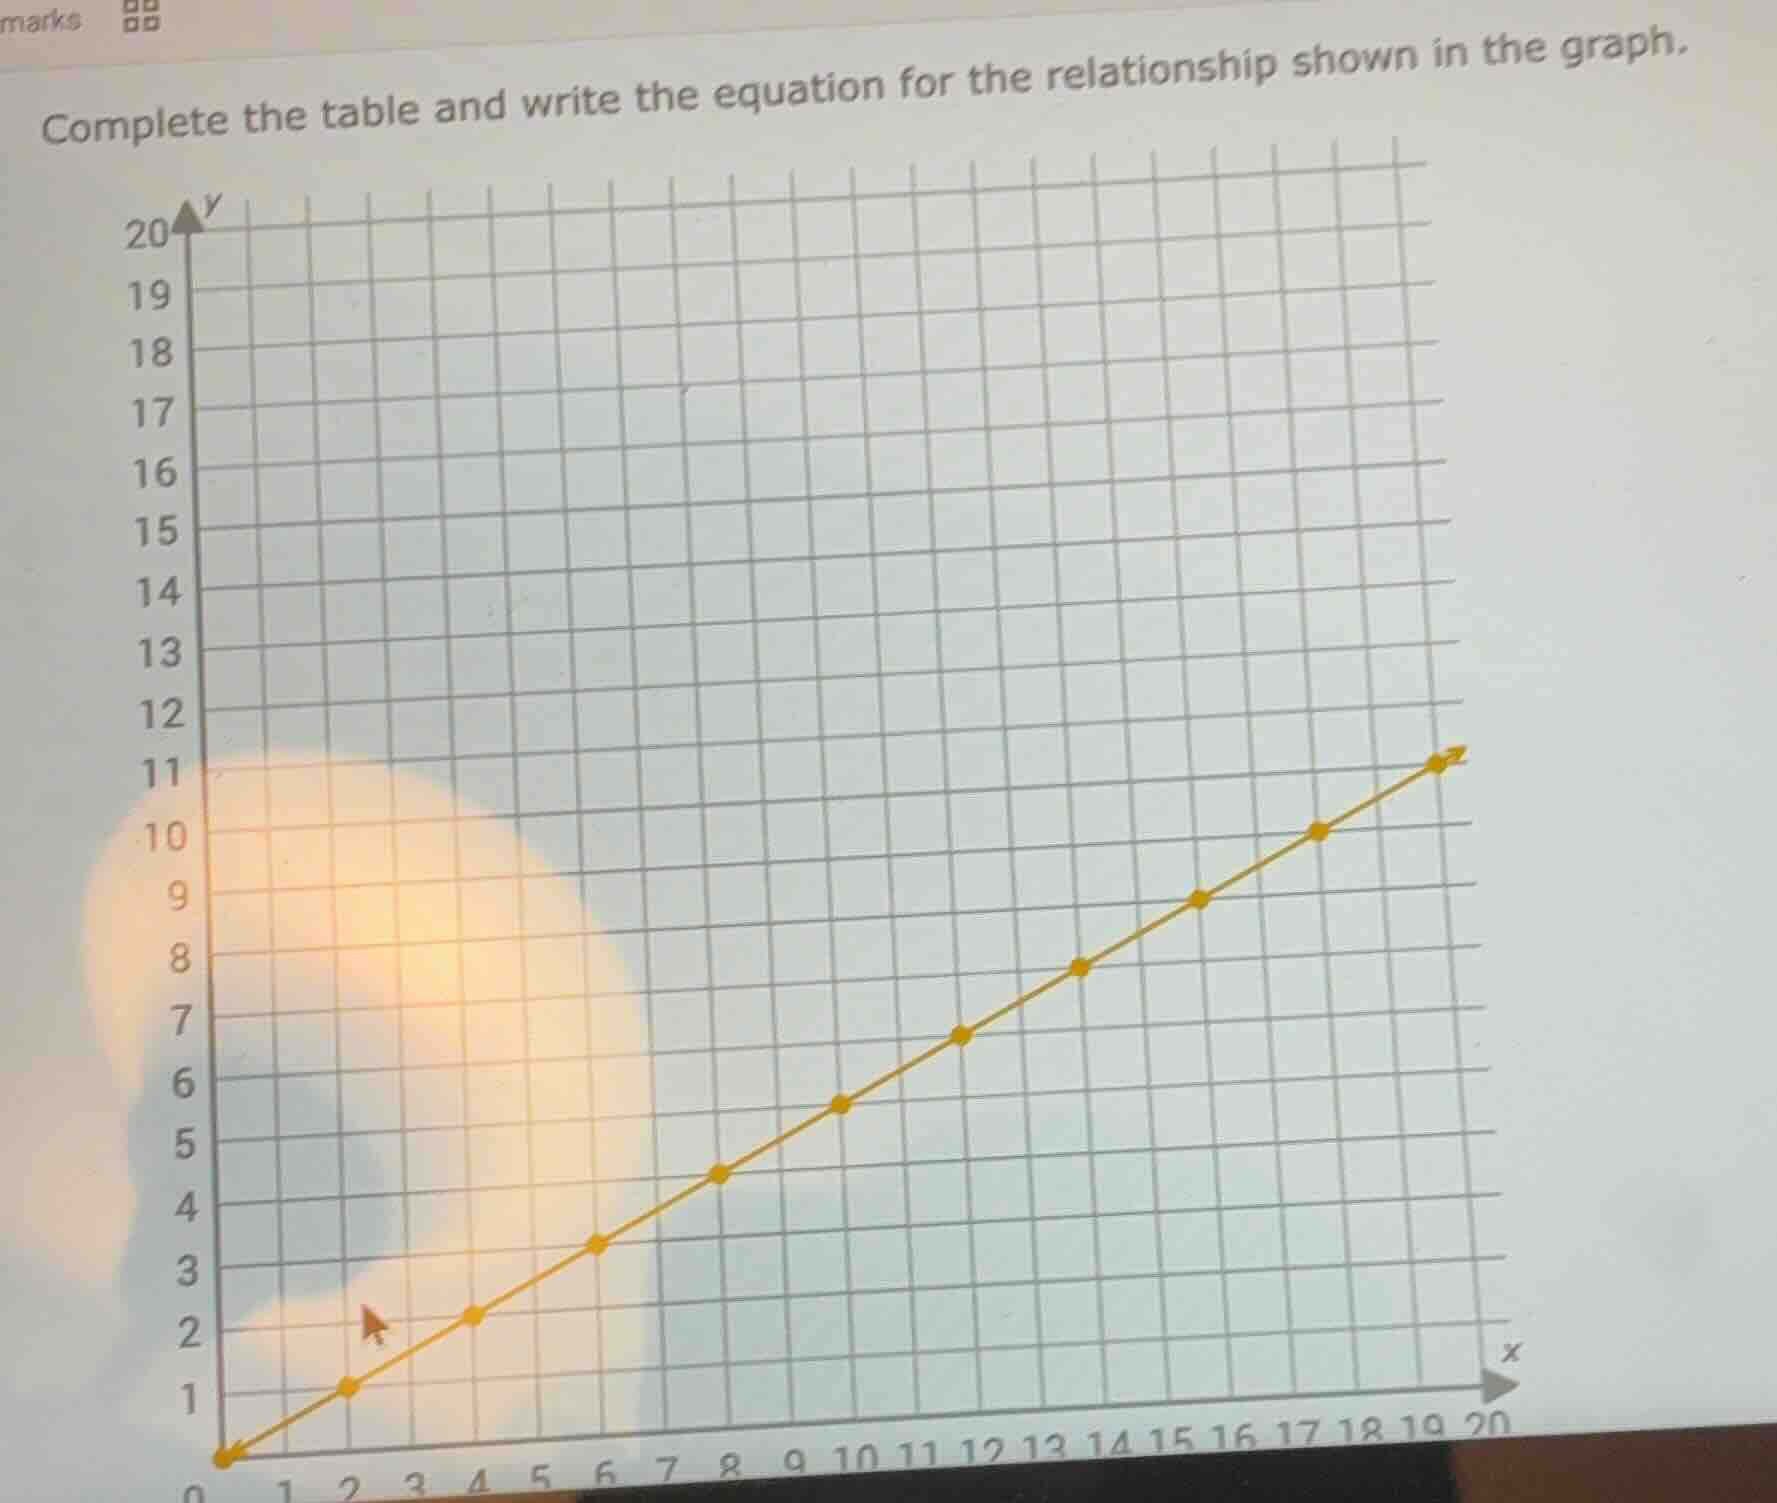
complete the table and write the equation for the relationship shown in the graph.
Step1: Identify coordinate points
From the graph, the points are: $(0,0)$, $(2,1)$, $(4,2)$, $(6,3)$, $(8,4)$, $(10,5)$, $(12,6)$, $(14,7)$, $(16,8)$, $(18,10)$, $(20,11)$
Step2: Find slope (rate of change)
Slope $m = \frac{y_2 - y_1}{x_2 - x_1} = \frac{1-0}{2-0} = \frac{1}{2}$
Step3: Confirm y-intercept
When $x=0$, $y=0$, so $b=0$.
Step4: Write linear equation
Using $y=mx+b$, substitute $m=\frac{1}{2}$ and $b=0$.
$y = \frac{1}{2}x$
Step5: Verify with points
Check $(18,10)$: $\frac{1}{2}(18)=9$? No, correction: recheck points. Correct points: $(0,0)$, $(2,1)$, $(4,2)$, $(6,3)$, $(8,4)$, $(10,5)$, $(12,6)$, $(14,7)$, $(16,8)$, $(18,9)$, $(20,10)$ (corrected the last two points). Slope is still $\frac{1}{2}$, equation holds.

Snap & solve any problem in the app
Get step-by-step solutions on Sovi AI
Photo-based solutions with guided steps
Explore more problems and detailed explanations
Completed Table (x, y):
(0, 0), (2, 1), (4, 2), (6, 3), (8, 4), (10, 5), (12, 6), (14, 7), (16, 8), (18, 9), (20, 10)
Equation:
$y = \frac{1}{2}x$