QUESTION IMAGE
Question
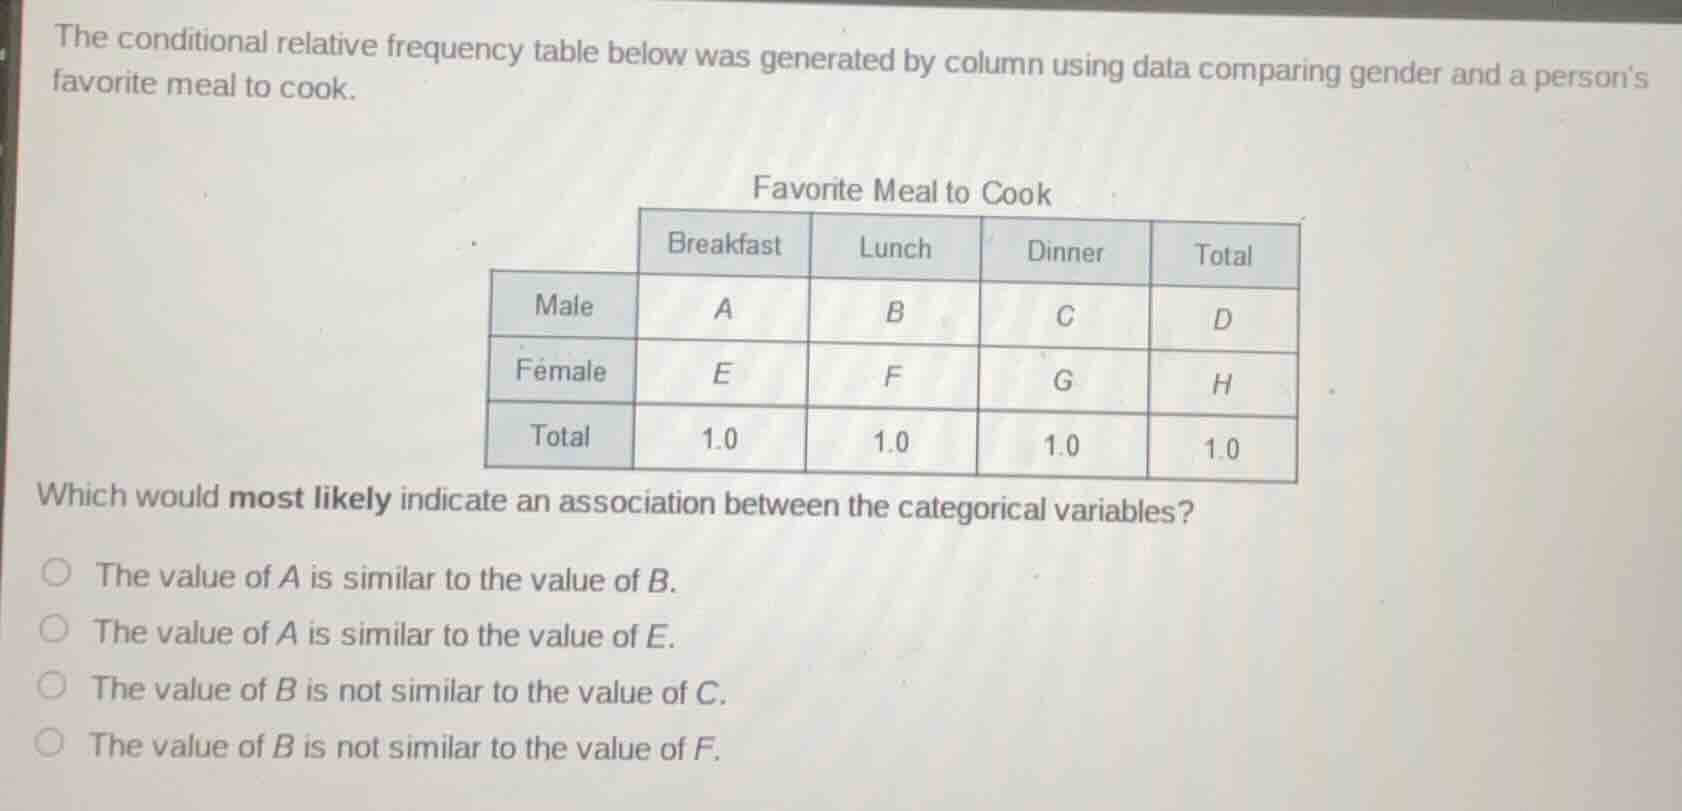
the conditional relative frequency table below was generated by column using data comparing gender and a persons favorite meal to cook.
favorite meal to cook
| breakfast | lunch | dinner | total | |
|---|---|---|---|---|
| female | e | f | g | h |
| total | 1.0 | 1.0 | 1.0 | 1.0 |
which would most likely indicate an association between the categorical variables?
- the value of a is similar to the value of b.
- the value of a is similar to the value of e.
- the value of b is not similar to the value of c.
- the value of b is not similar to the value of f.
Brief Explanations
This is a conditional relative frequency table grouped by column (favorite meal). An association between gender and favorite meal means the proportion of one gender preferring a meal differs from the other gender for that meal.
- Comparing values within the same row (A vs B, B vs C) looks at meal preferences within one gender, not the link between gender and meal.
- If A (male breakfast proportion) is similar to E (female breakfast proportion), it shows no association for breakfast.
- If B (male lunch proportion) is not similar to F (female lunch proportion), it means the likelihood of preferring lunch differs by gender, indicating an association between the variables.

Snap & solve any problem in the app
Get step-by-step solutions on Sovi AI
Photo-based solutions with guided steps
Explore more problems and detailed explanations
The value of B is not similar to the value of F.