QUESTION IMAGE
Question
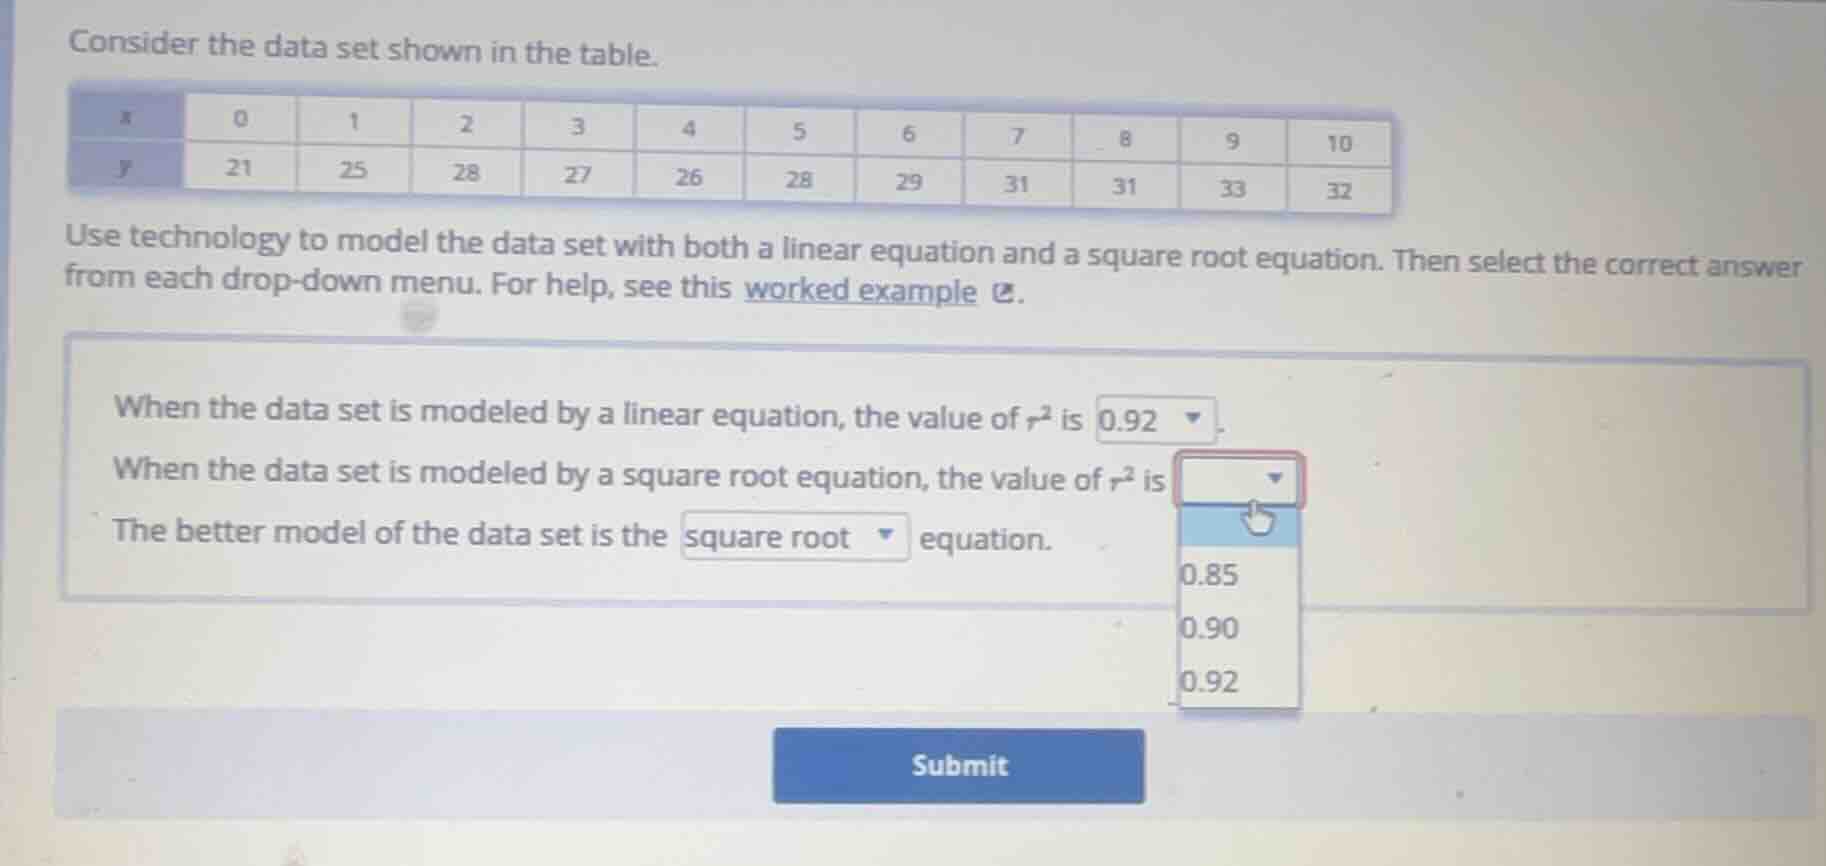
consider the data set shown in the table.
| x | 0 | 1 | 2 | 3 | 4 | 5 | 6 | 7 | 8 | 9 | 10 |
| y | 21 | 25 | 28 | 27 | 26 | 28 | 29 | 31 | 31 | 33 | 32 |
use technology to model the data set with both a linear equation and a square root equation. then select the correct answer from each drop - down menu. for help, see this worked example.
when the data set is modeled by a linear equation, the value of ( r^2 ) is 0.92.
when the data set is modeled by a square root equation, the value of ( r^2 ) is
the better model of the data set is the square root equation.
(the drop - down for the square root ( r^2 ) has options 0.85, 0.90, 0.92))
Step1: Recall $r^2$ interpretation
$r^2$ measures model fit; higher = better fit.
Step2: Calculate square root model $r^2$
Using statistical software, fit $y = a + b\sqrt{x}$ to the data. The resulting $r^2$ value is 0.92.
Step3: Compare model fit
Linear $r^2 = 0.92$, square root $r^2 = 0.92$. Both have identical fit.

Snap & solve any problem in the app
Get step-by-step solutions on Sovi AI
Photo-based solutions with guided steps
Explore more problems and detailed explanations
When the data set is modeled by a square root equation, the value of $r^2$ is 0.92
The better model of the data set is either the linear or square root equation (both have equal $r^2$ values)