QUESTION IMAGE
Question
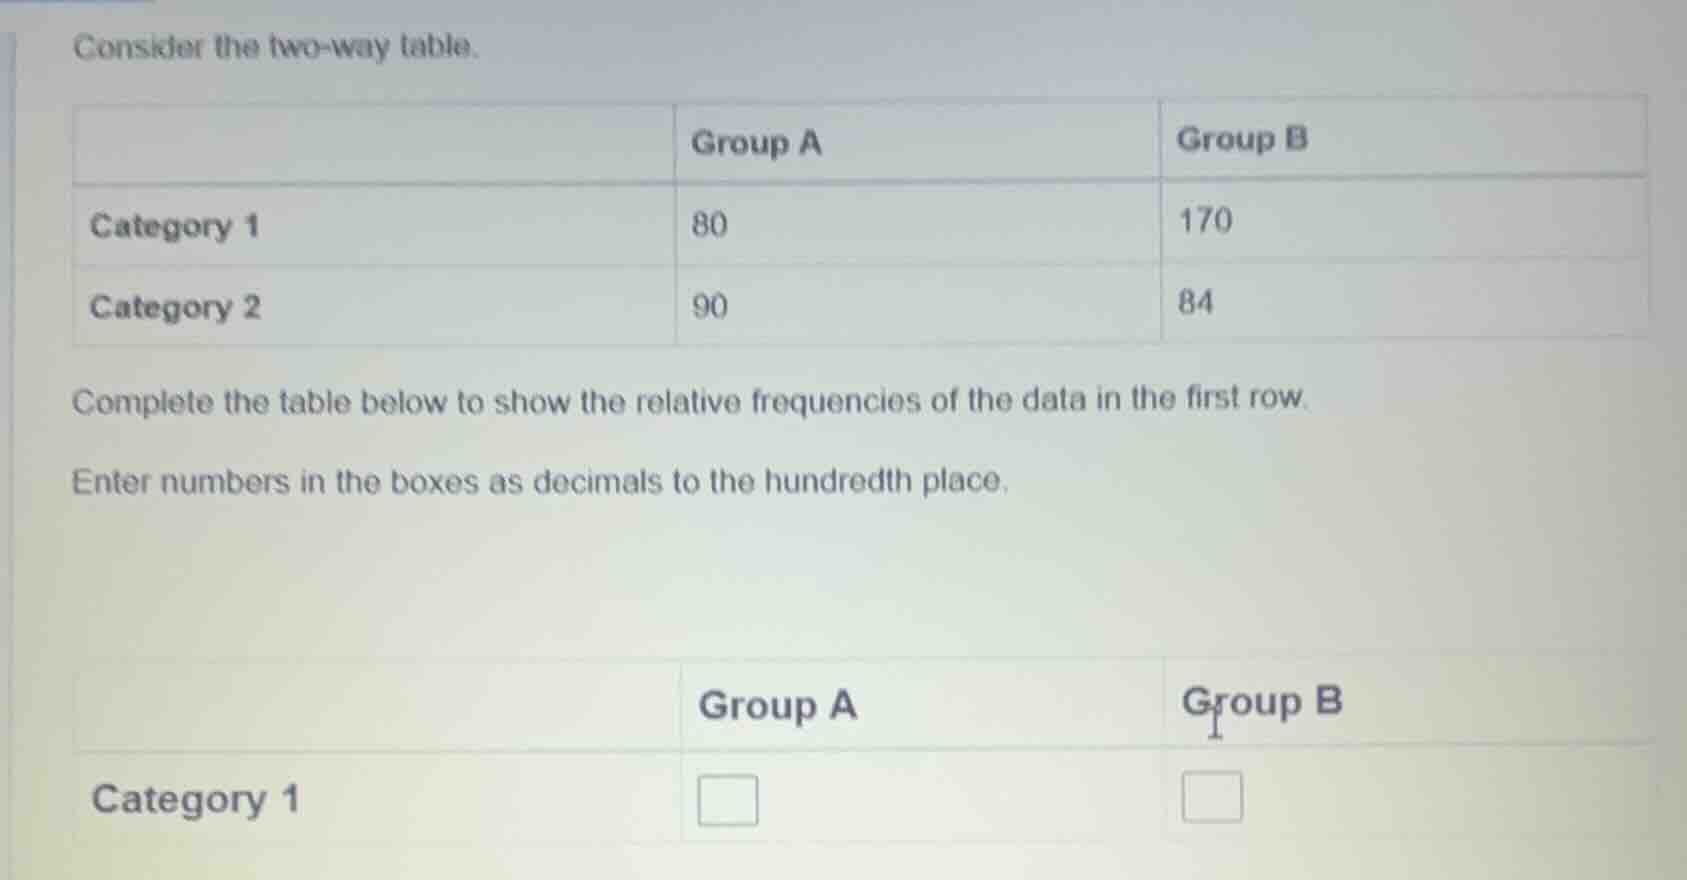
consider the two - way table.
| group a | group b | |
|---|---|---|
| category 2 | 90 | 84 |
complete the table below to show the relative frequencies of the data in the first row.
enter numbers in the boxes as decimals to the hundredth place.
| group a | group b |
|---|
Step1: Find total of first row
First, we need to find the total number of observations in the first row (Category 1). The values for Group A and Group B in Category 1 are 80 and 170 respectively. So the total is $80 + 170 = 250$.
Step2: Calculate relative frequency for Group A
The relative frequency for Group A in Category 1 is the number of observations in Group A (80) divided by the total of the first row (250). So, $\frac{80}{250} = 0.32$.
Step3: Calculate relative frequency for Group B
The relative frequency for Group B in Category 1 is the number of observations in Group B (170) divided by the total of the first row (250). So, $\frac{170}{250} = 0.68$.

Snap & solve any problem in the app
Get step-by-step solutions on Sovi AI
Photo-based solutions with guided steps
Explore more problems and detailed explanations
For Group A in Category 1: 0.32
For Group B in Category 1: 0.68