QUESTION IMAGE
Question
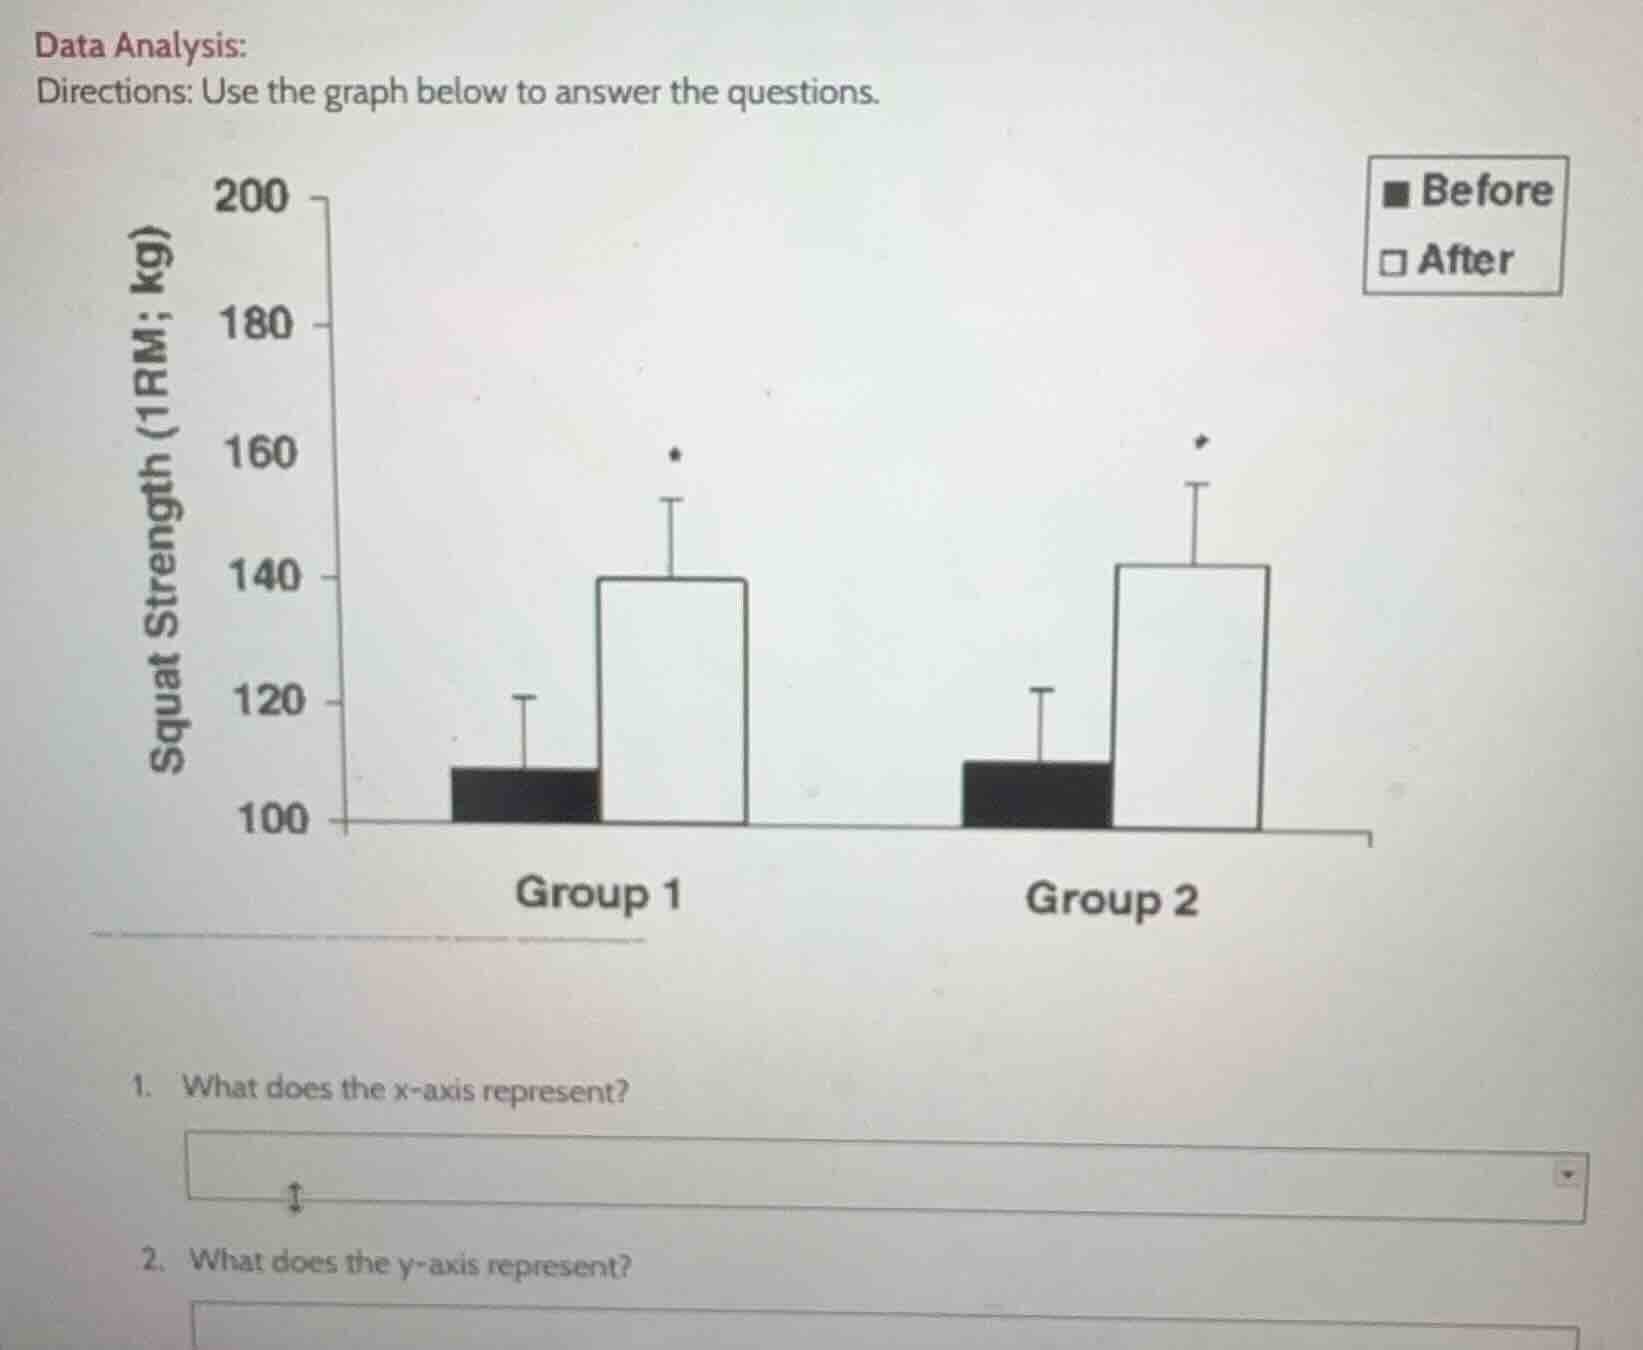
data analysis:
directions: use the graph below to answer the questions.
- what does the x - axis represent?
- what does the y - axis represent?
Brief Explanations
- The x-axis labels are "Group 1" and "Group 2", so it represents the different test groups.
- The y-axis is clearly labeled "Squat Strength (1RM; kg)", so it measures this specific strength metric.

Snap & solve any problem in the app
Get step-by-step solutions on Sovi AI
Photo-based solutions with guided steps
Explore more problems and detailed explanations
- The different experimental groups (Group 1 and Group 2)
- Squat Strength (1RM; kg) (one-repetition maximum squat strength measured in kilograms)