QUESTION IMAGE
Question
data analysis and probability
constructing a box - and - whisker plot
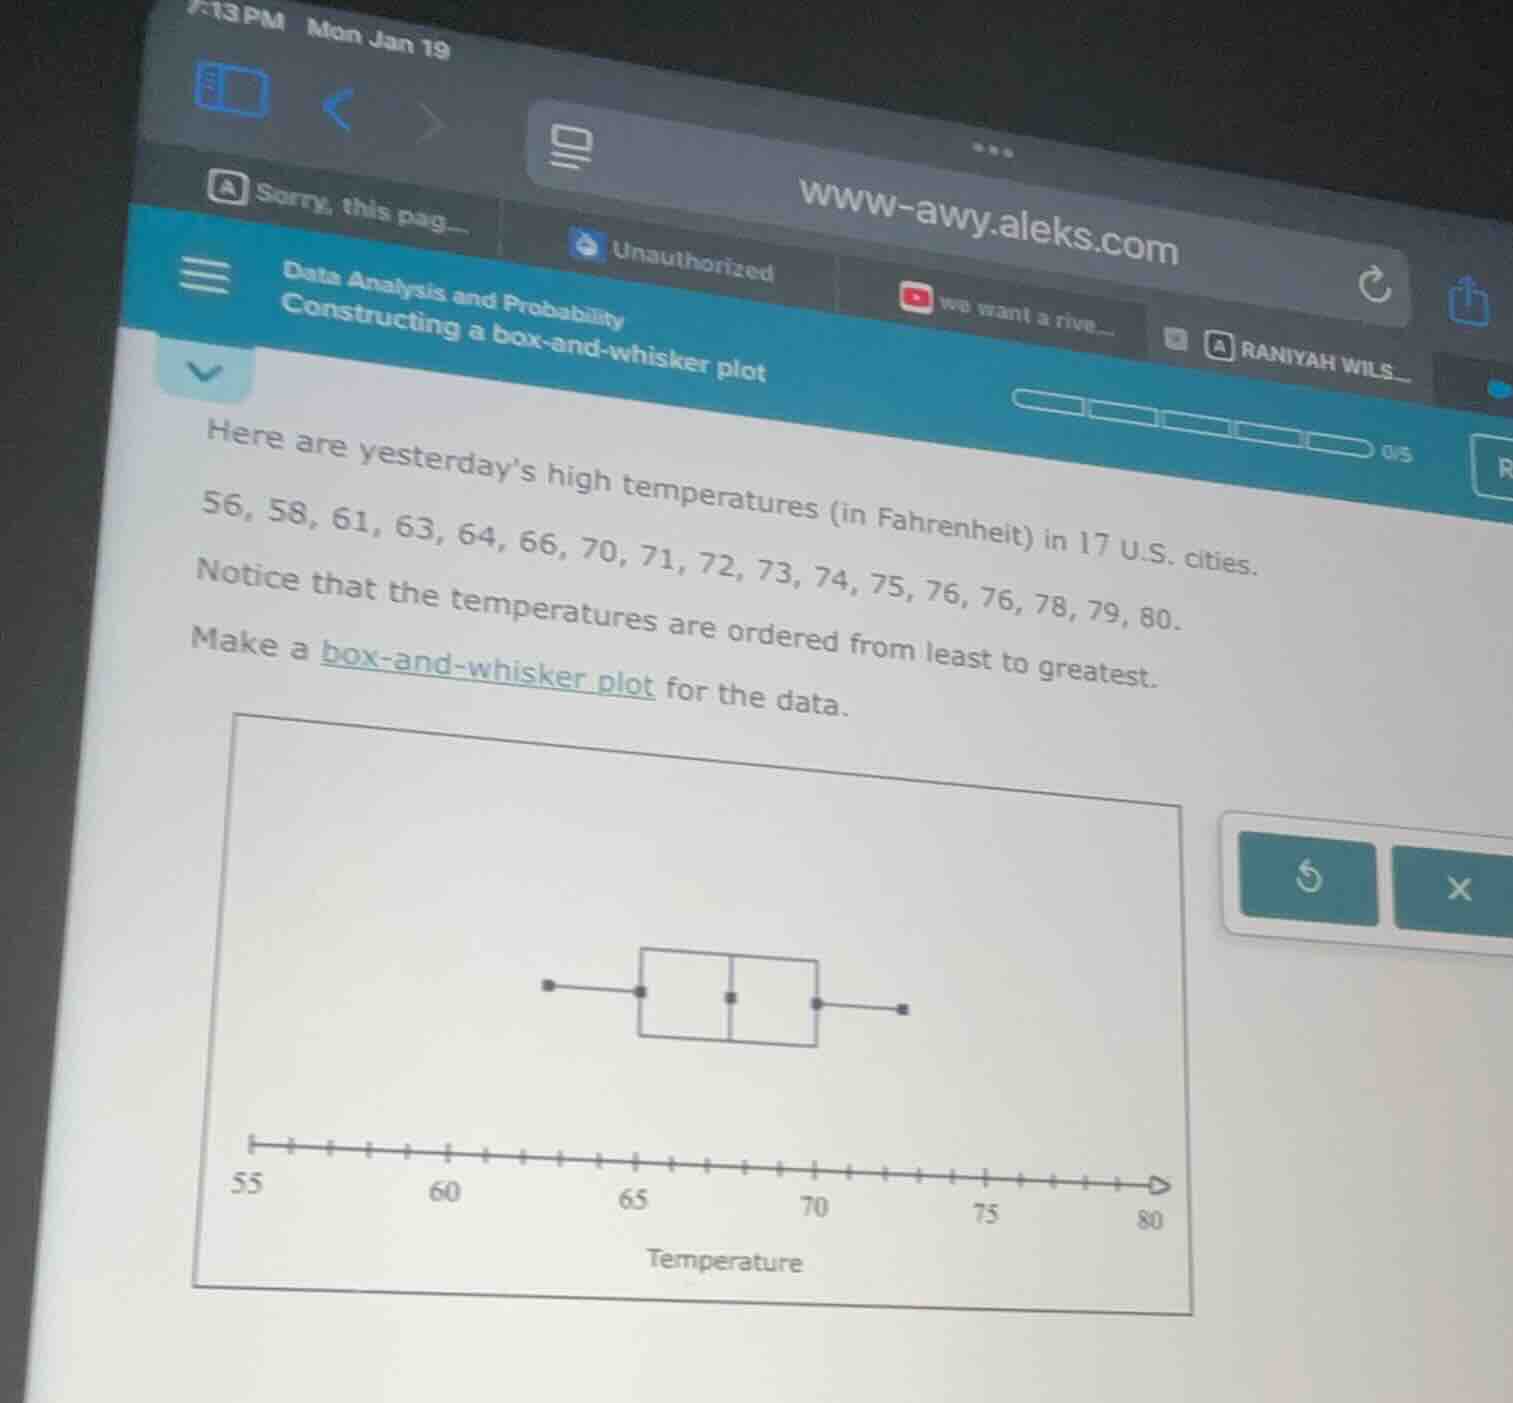
here are yesterday’s high temperatures (in fahrenheit) in 17 u.s. cities.
56, 58, 61, 63, 64, 66, 70, 71, 72, 73, 74, 75, 76, 76, 78, 79, 80.
notice that the temperatures are ordered from least to greatest.
make a box - and - whisker plot for the data.
Step1: Find the minimum value
The minimum value is the first number in the ordered list. So, minimum = 56.
Step2: Find the first quartile (Q1)
The data set has \( n = 17 \) values. The position of Q1 is \( \frac{n + 1}{4}=\frac{17+ 1}{4}=4.5 \). We take the average of the 4th and 5th values. The 4th value is 63, the 5th is 64. So, \( Q1=\frac{63 + 64}{2}=63.5 \). But wait, actually, for odd \( n \), the formula for the position of Q1 is \( \lfloor\frac{n}{4}
floor+ 1 \). \( n = 17 \), \( \lfloor\frac{17}{4}
floor = 4 \), so Q1 is the 5th value? Wait, no, let's recall: for a data set with \( n \) elements (ordered), the median (Q2) is at position \( \frac{n + 1}{2} \). For \( n = 17 \), median position is \( \frac{17+1}{2}=9 \), so the 9th value is 71 (since the list is 56, 58, 61, 63, 64, 66, 70, 71, 72, 73, 74, 75, 76, 76, 78, 79, 80? Wait, wait, the original data: 56, 58, 61, 63, 64, 66, 70, 71, 72, 73, 74, 75, 76, 76, 78, 79, 80. Wait, that's 17 numbers? Let's count: 1.56, 2.58, 3.61, 4.63, 5.64, 6.66, 7.70, 8.71, 9.72, 10.73, 11.74, 12.75, 13.76, 14.76, 15.78, 16.79, 17.80. Oh, I miscounted earlier. So median (Q2) is the 9th value, which is 72. Now, Q1 is the median of the lower half (first 8 numbers: 56, 58, 61, 63, 64, 66, 70, 71). The lower half has 8 numbers, so Q1 is the average of the 4th and 5th values of the lower half. Lower half: positions 1 - 8: 56(1), 58(2), 61(3), 63(4), 64(5), 66(6), 70(7), 71(8). So Q1 = \( \frac{63+64}{2}=63.5 \). Q3 is the median of the upper half (last 8 numbers: 73, 74, 75, 76, 76, 78, 79, 80). Upper half: positions 10 - 17: 73(1), 74(2), 75(3), 76(4), 76(5), 78(6), 79(7), 80(8). Q3 is the average of the 4th and 5th values: \( \frac{76 + 76}{2}=76 \). Maximum value is 80.
Wait, but the initial data list: let's re - list correctly: 56, 58, 61, 63, 64, 66, 70, 71, 72, 73, 74, 75, 76, 76, 78, 79, 80. So n = 17.
Minimum: 56
Q1: The lower half is the first 8 numbers (since median is at 9th, so lower half is 1 - 8, upper half is 10 - 17). For lower half (8 numbers), Q1 is the median of these 8, which is the average of the 4th and 5th in the lower half. Lower half: [56, 58, 61, 63, 64, 66, 70, 71]. 4th: 63, 5th: 64. So Q1=(63 + 64)/2 = 63.5
Median (Q2): 9th number, which is 72
Q3: Upper half is [73, 74, 75, 76, 76, 78, 79, 80]. Median of upper half (8 numbers) is average of 4th and 5th. 4th:76, 5th:76. So Q3=(76 + 76)/2 = 76
Maximum: 80
Now, to construct the box - and - whisker plot:
- The left whisker goes from minimum (56) to Q1 (63.5)
- The box goes from Q1 (63.5) to Q3 (76), with a line at the median (72)
- The right whisker goes from Q3 (76) to maximum (80)

Snap & solve any problem in the app
Get step-by-step solutions on Sovi AI
Photo-based solutions with guided steps
Explore more problems and detailed explanations
The box - and - whisker plot has:
- Minimum: 56
- Q1: 63.5
- Median (Q2): 72
- Q3: 76
- Maximum: 80
To draw the plot:
- Plot a point at 56 (left end of whisker)
- Plot a point at 63.5 (left end of box)
- Plot a line at 72 (inside the box, median)
- Plot a point at 76 (right end of box)
- Plot a point at 80 (right end of whisker)
And draw the box between 63.5 and 76, whiskers from 56 to 63.5 and 76 to 80.