QUESTION IMAGE
Question
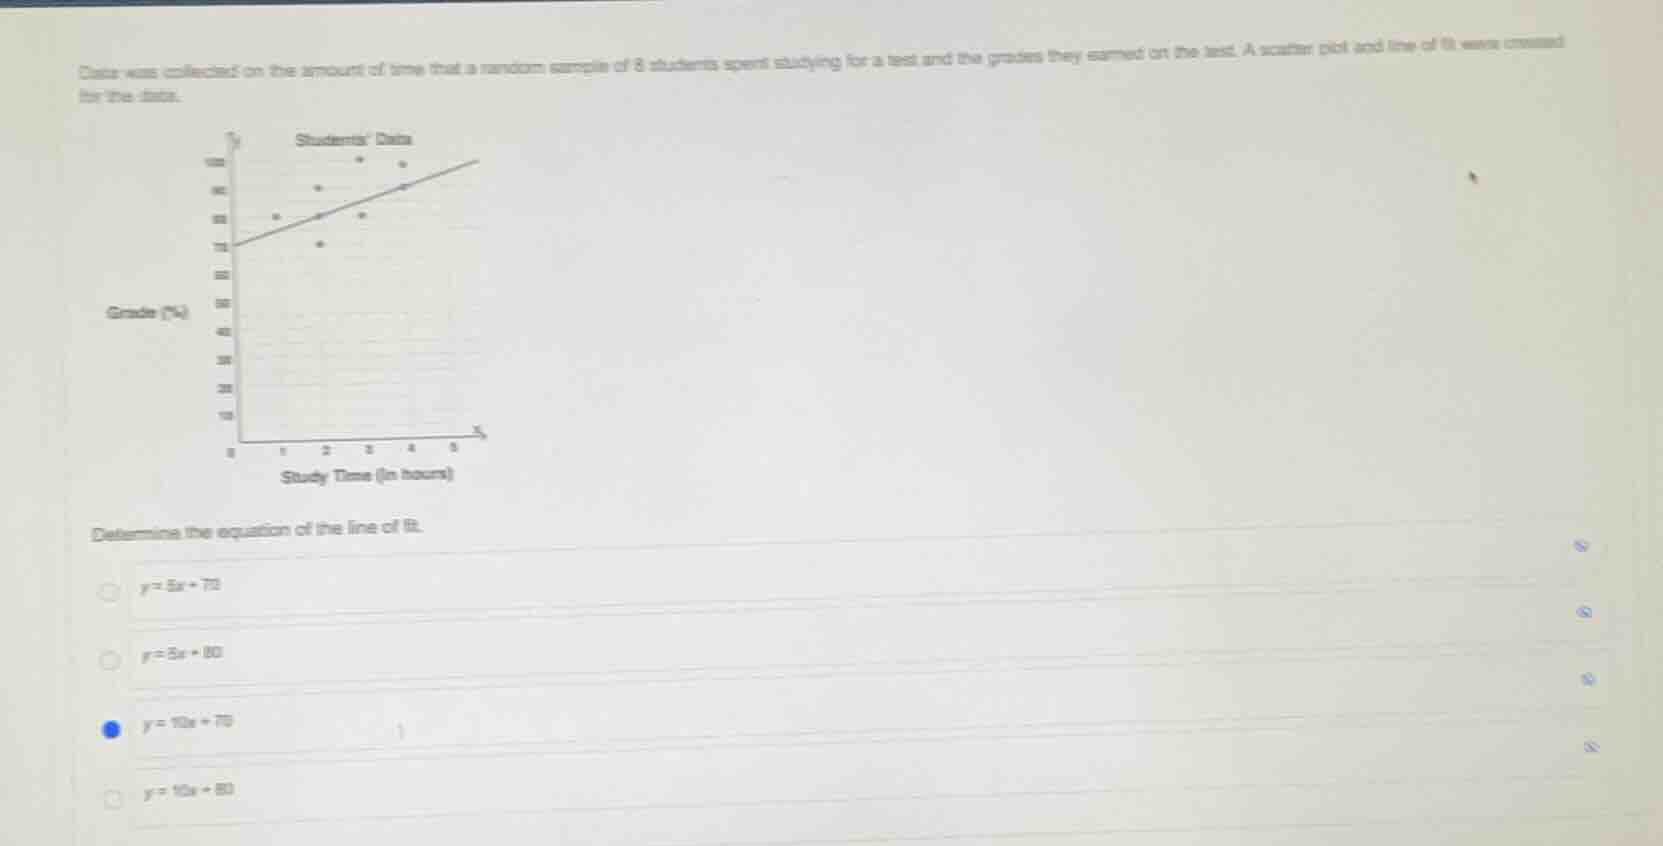
data was collected on the amount of time that a random sample of 8 students spent studying for a test and the grades they earned on the test. a scatter plot and line of fit were created for the data.
determine the equation of the line of fit.
$y = 5x + 70$
$y = 5x + 80$
$y = 10x + 70$
$y = 10x + 80$
Step1: Identify y-intercept
The line crosses the y-axis at $y=70$, so $b=70$.
Step2: Calculate slope
Use two points on the line, e.g., $(0,70)$ and $(5,100)$.
Slope $m=\frac{100-70}{5-0}=\frac{30}{5}=6$.
Step3: Form line equation
Use slope-intercept form $y=mx+b$.

Snap & solve any problem in the app
Get step-by-step solutions on Sovi AI
Photo-based solutions with guided steps
Explore more problems and detailed explanations
A. $y = 6x + 70$