QUESTION IMAGE
Question
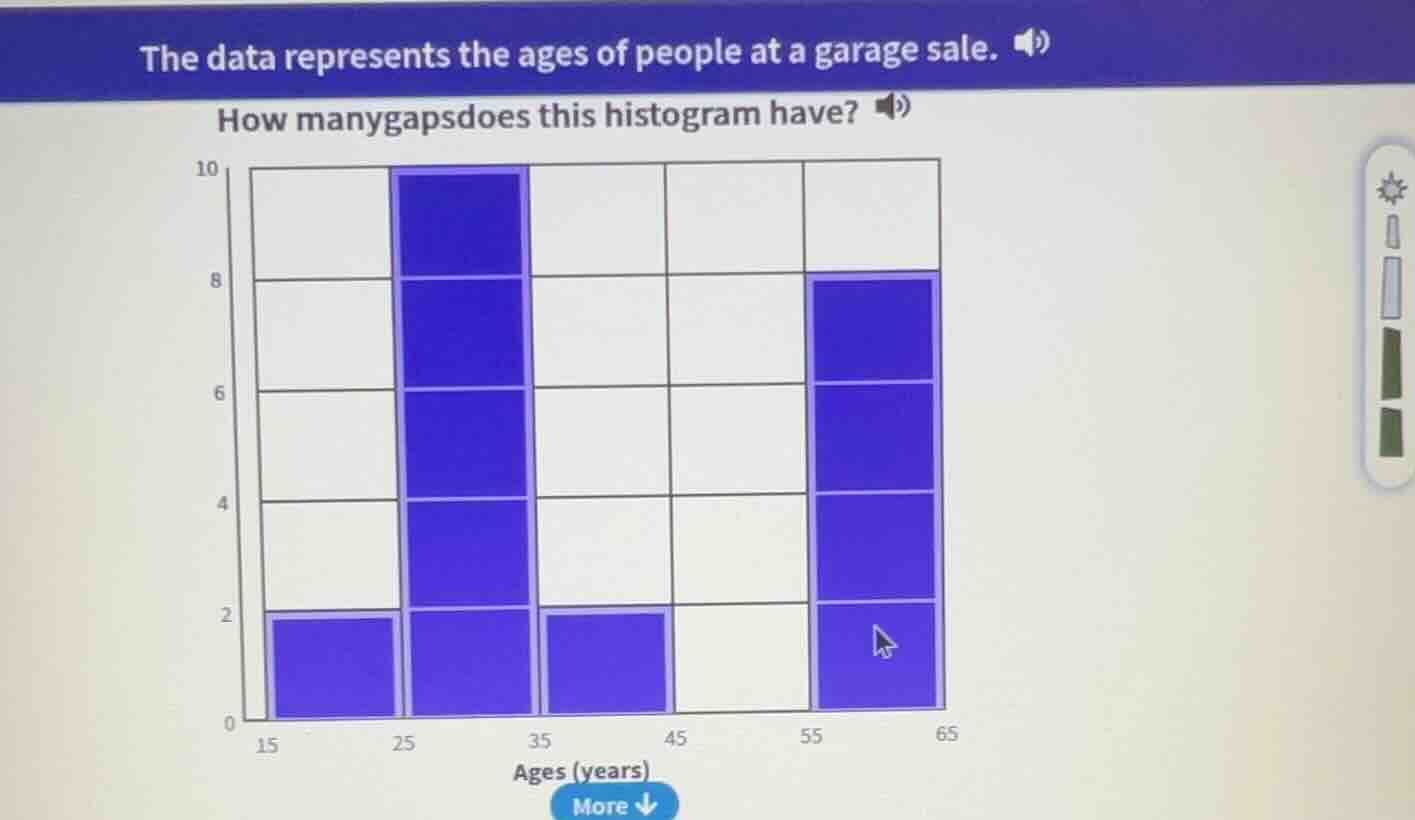
the data represents the ages of people at a garage sale. how many gaps does this histogram have?
Step1: Identify bar groups
The histogram has bars in groups: 15 - 25, 25 - 35, 35 - 45, 45 - 55, 55 - 65.
Step2: Find gaps between groups
- Between 15 - 25 and 25 - 35: no gap (adjacent).
- Between 25 - 35 and 35 - 45: no gap (adjacent).
- Between 35 - 45 and 45 - 55: gap (no bars in 45 - 55).
- Between 45 - 55 and 55 - 65: no gap (adjacent? Wait, 45 - 55 has no bars, 55 - 65 has bars. Wait, re - evaluate:
- Group 1: 15 - 25 (bar height 2)
- Group 2: 25 - 35 (bar height 10)
- Group 3: 35 - 45 (bar height 2)
- Group 4: 45 - 55 (bar height 0)
- Group 5: 55 - 65 (bar height 8)
A gap is a non - adjacent group with no data between two groups with data.
- Between group 1 (15 - 25) and group 2 (25 - 35): adjacent, no gap.
- Between group 2 (25 - 35) and group 3 (35 - 45): adjacent, no gap.
- Between group 3 (35 - 45) and group 5 (55 - 65): there is group 4 (45 - 55) in between with no data. Wait, no, the gap is between group 3 (35 - 45) and group 5 (55 - 65)? No, let's look at the intervals:
The intervals are 15 - 25, 25 - 35, 35 - 45, 45 - 55, 55 - 65.
The data - containing intervals are 15 - 25, 25 - 35, 35 - 45, 55 - 65.
The gap is between 35 - 45 and 55 - 65? No, the interval 45 - 55 is between them with no data. Wait, actually, a gap in a histogram is a region between two bars (or groups of bars) where there are no bars.
Let's list the bars:
- First bar: 15 - 25 (height 2)
- Second bar: 25 - 35 (height 10)
- Third bar: 35 - 45 (height 2)
- Fourth "bar": 45 - 55 (height 0, no bar)
- Fifth bar: 55 - 65 (height 8)
So the gaps are:
- Between 35 - 45 (third bar) and 55 - 65 (fifth bar): the interval 45 - 55 has no bar, so that's one gap? Wait, no, let's check the spaces between the bars:
The first bar (15 - 25) and the second bar (25 - 35) are adjacent (no gap).
The second bar (25 - 35) and the third bar (35 - 45) are adjacent (no gap).
The third bar (35 - 45) and the fifth bar (55 - 65): there is a space (45 - 55) with no bar. So that's one gap? Wait, no, maybe I made a mistake. Wait, the x - axis intervals: 15 - 25, 25 - 35, 35 - 45, 45 - 55, 55 - 65.
The bars are present in 15 - 25, 25 - 35, 35 - 45, 55 - 65.
The gap is between 35 - 45 and 55 - 65? No, the interval 45 - 55 is between them. Wait, actually, a gap is a place where there are no data points between two clusters of data.
Cluster 1: 15 - 25 (bar height 2)
Cluster 2: 25 - 35 (bar height 10), 35 - 45 (bar height 2)
Cluster 3: 55 - 65 (bar height 8)
So between cluster 2 (35 - 45) and cluster 3 (55 - 65), there is a gap (45 - 55 has no data). Also, is there a gap between cluster 1 (15 - 25) and cluster 2 (25 - 35)? No, because 15 - 25 and 25 - 35 are adjacent. Wait, no, the first bar is 15 - 25 (height 2), the second is 25 - 35 (height 10). They are adjacent, so no gap. The third bar is 35 - 45 (height 2), then 45 - 55 (height 0), then 55 - 65 (height 8). So the gap is between 35 - 45 and 55 - 65? Wait, no, the 45 - 55 interval has no bar, and it's between 35 - 45 and 55 - 65. So that's one gap? Wait, maybe I miscounted. Let's look at the histogram again:
- The first bar (15 - 25) and the second bar (25 - 35): connected (no gap).
- The second bar (25 - 35) and the third bar (35 - 45): connected (no gap).
- The third bar (35 - 45) and the fifth bar (55 - 65): there is a missing bar in 45 - 55, so that's a gap. Also, is there a gap between the first bar (15 - 25) and the second bar? No. Wait, maybe the correct way is to look for the number of times there is a break between the bars.
The bars ar…

Snap & solve any problem in the app
Get step-by-step solutions on Sovi AI
Photo-based solutions with guided steps
Explore more problems and detailed explanations
1