QUESTION IMAGE
Question
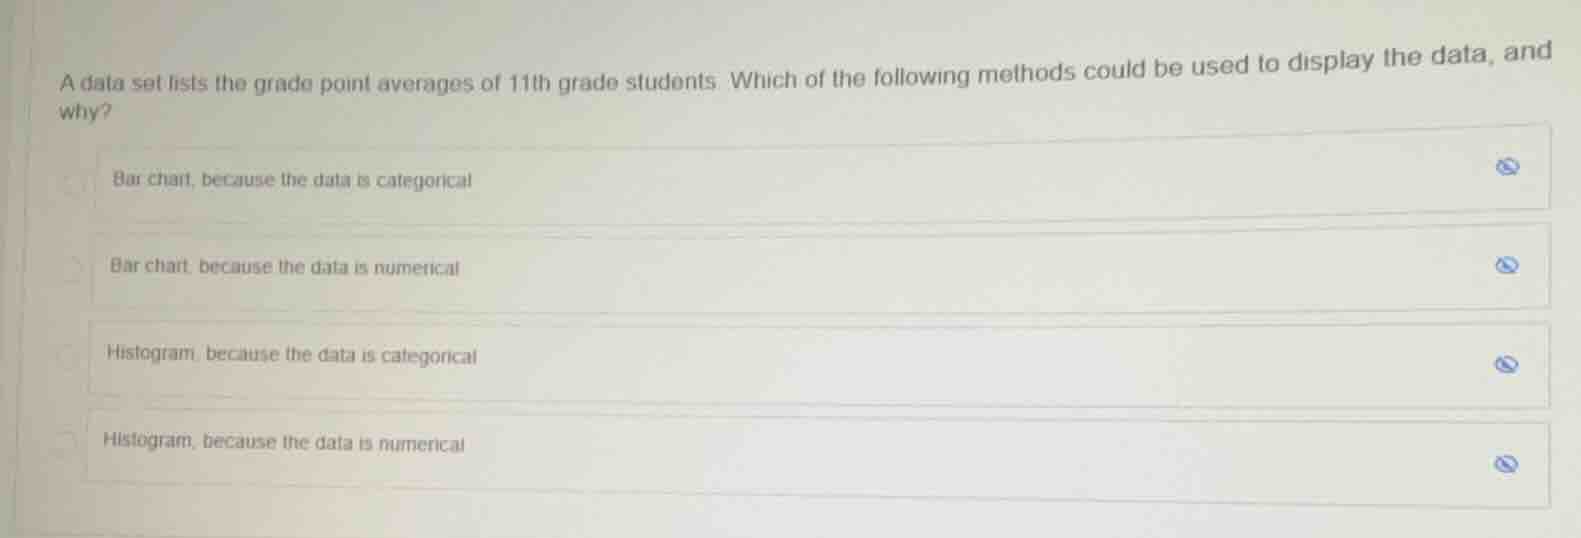
a data set lists the grade point averages of 11th grade students. which of the following methods could be used to display the data, and why?
bar chart, because the data is categorical
bar chart, because the data is numerical
histogram, because the data is categorical
histogram, because the data is numerical
Grade point averages (GPAs) are numerical data that represent continuous, quantitative values. Histograms are used to display the distribution of numerical data, while bar charts are for categorical data. The correct method matches the data type to the appropriate display.

Snap & solve any problem in the app
Get step-by-step solutions on Sovi AI
Photo-based solutions with guided steps
Explore more problems and detailed explanations
Histogram, because the data is numerical