QUESTION IMAGE
Question
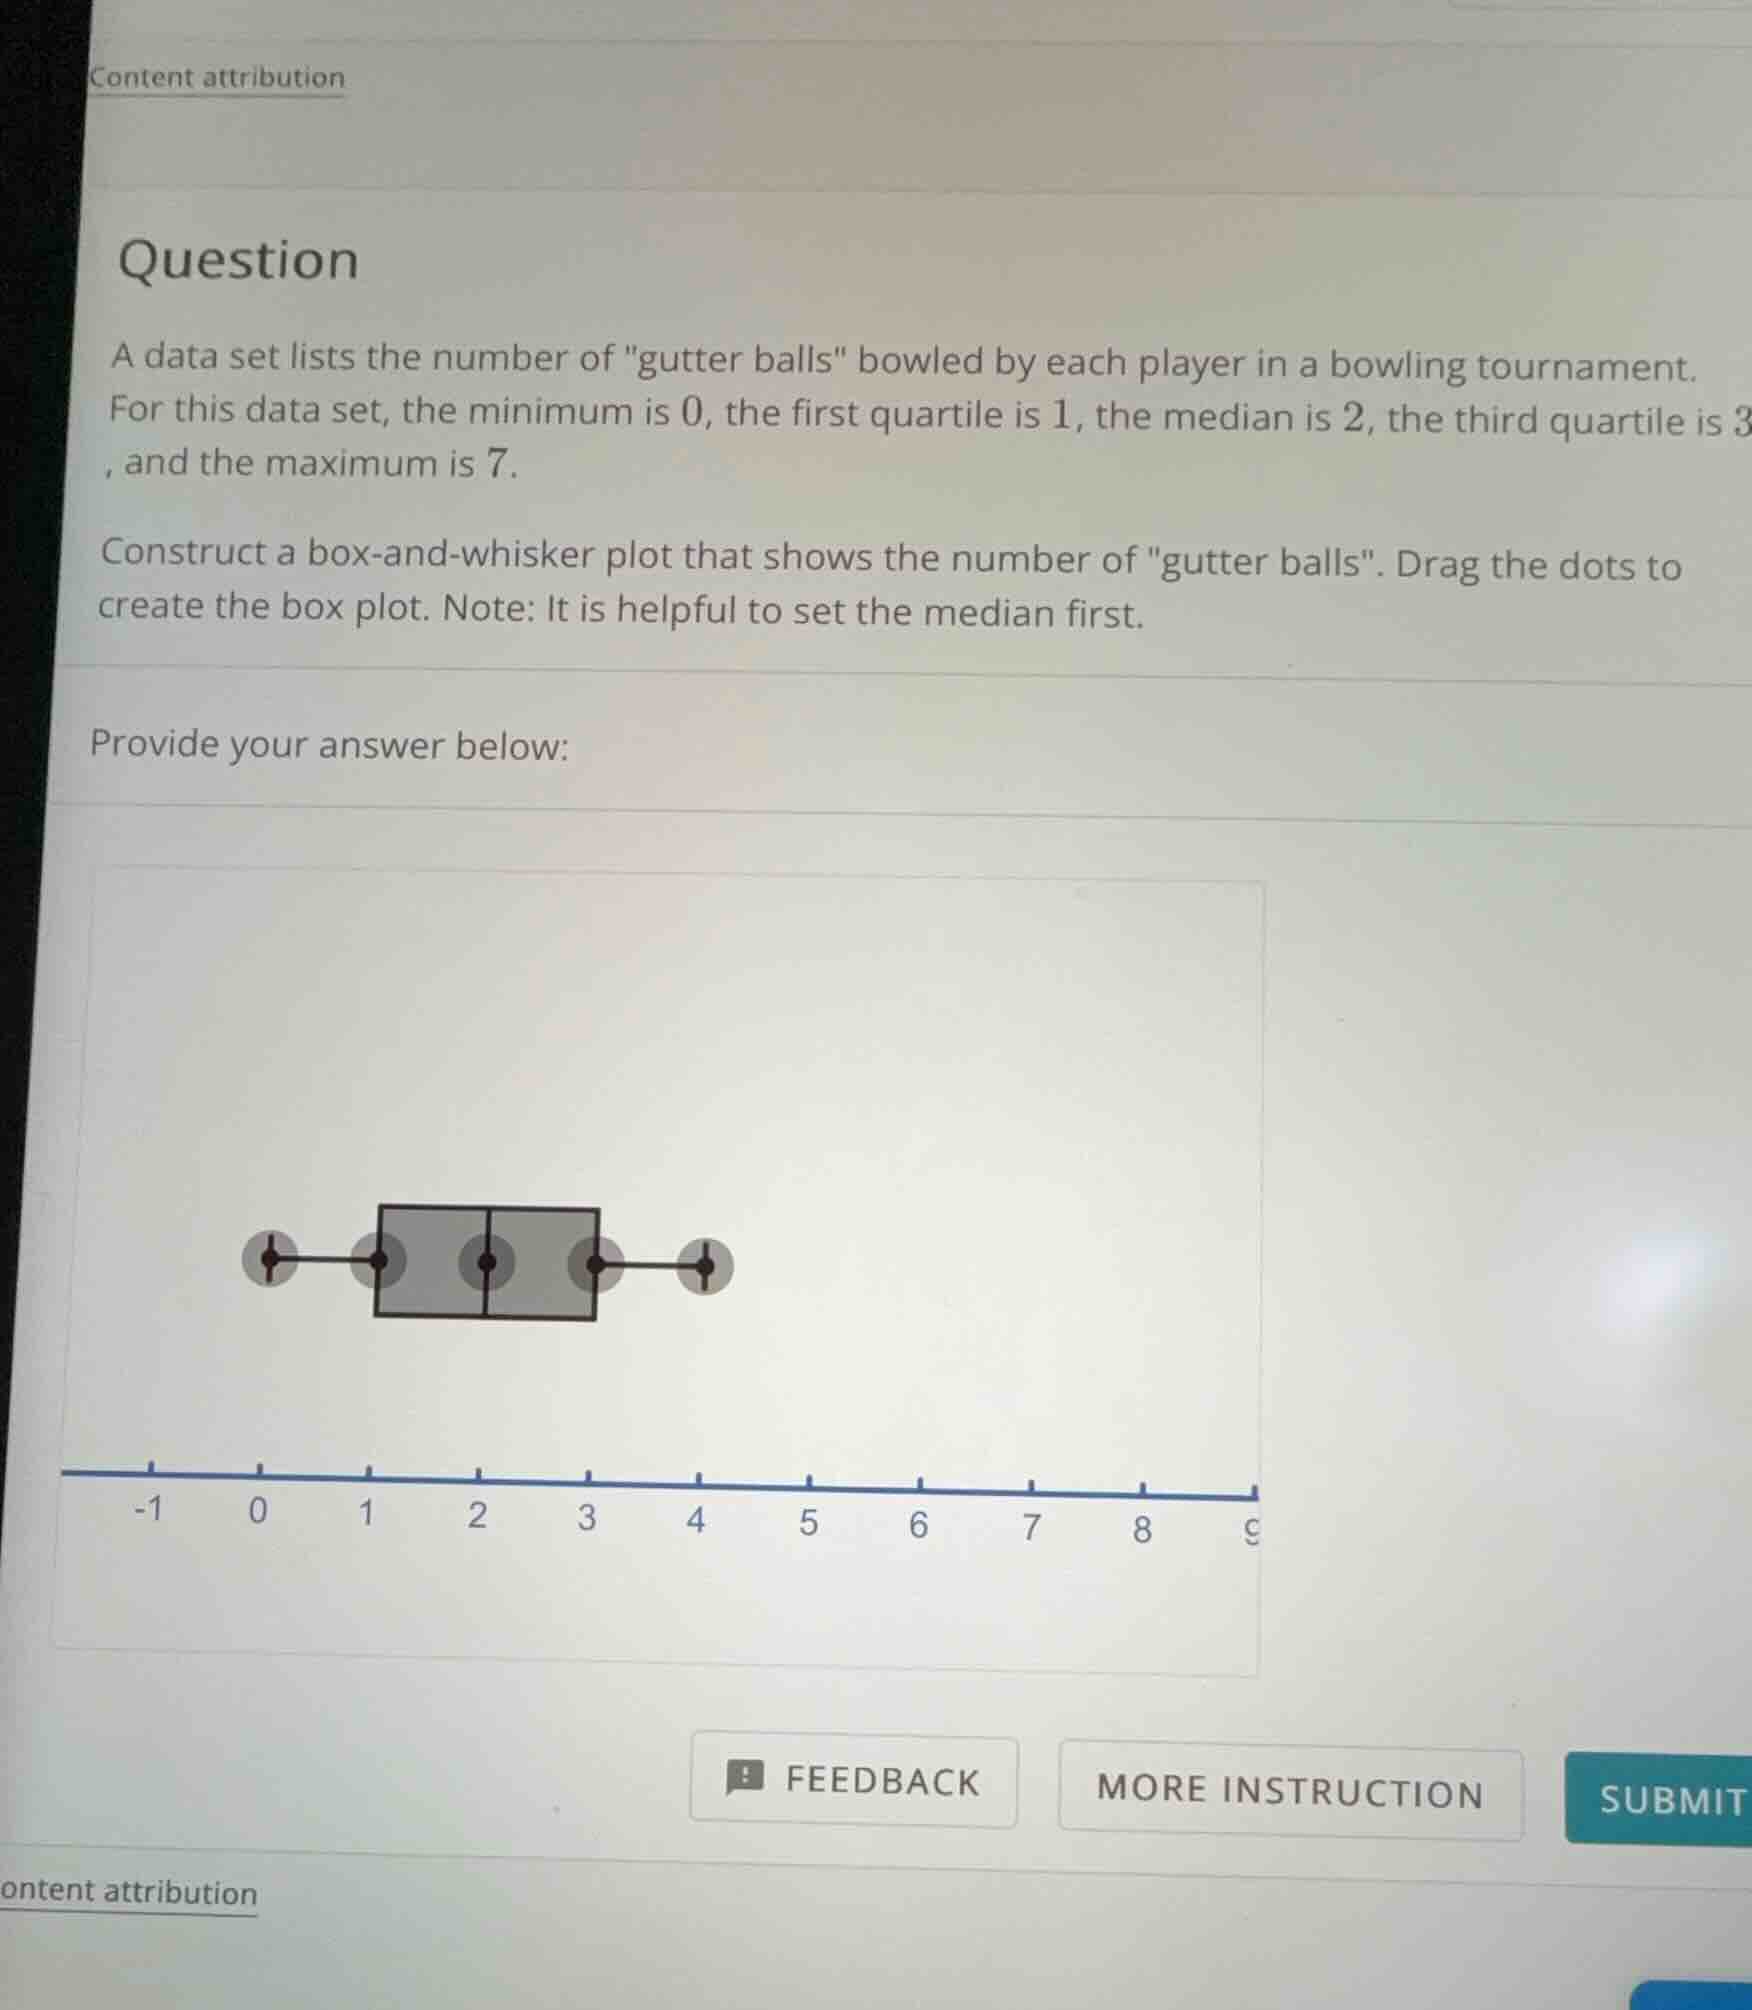
a data set lists the number of \gutter balls\ bowled by each player in a bowling tournament. for this data set, the minimum is 0, the first quartile is 1, the median is 2, the third quartile is 3, and the maximum is 7. construct a box - and - whisker plot that shows the number of \gutter balls\. drag the dots to create the box plot. note: it is helpful to set the median first. provide your answer below:
Step1: Identify the five - number summary
The five - number summary for a box - and - whisker plot consists of the minimum, first quartile (\(Q_1\)), median (\(Q_2\)), third quartile (\(Q_3\)), and maximum. From the problem, we have:
- Minimum (\(min\)) = 0
- First quartile (\(Q_1\)) = 1
- Median (\(Q_2\)) = 2
- Third quartile (\(Q_3\)) = 3
- Maximum (\(max\)) = 7
Step2: Position the points on the number line
- The left - most dot (minimum) should be placed at 0.
- The dot for the first quartile should be placed at 1.
- The dot for the median should be placed at 2.
- The dot for the third quartile should be placed at 3.
- The right - most dot (maximum) should be placed at 7.
The box is drawn between \(Q_1 = 1\) and \(Q_3=3\), with a line inside the box at the median \(Q_2 = 2\). The whiskers extend from the minimum (0) to \(Q_1\) (1) and from \(Q_3\) (3) to the maximum (7).

Snap & solve any problem in the app
Get step-by-step solutions on Sovi AI
Photo-based solutions with guided steps
Explore more problems and detailed explanations
To construct the box - and - whisker plot:
- Place the minimum dot at 0.
- Place the first quartile dot at 1.
- Place the median dot at 2.
- Place the third quartile dot at 3.
- Place the maximum dot at 7.
The box is between 1 and 3, with a line at 2 (the median), and whiskers from 0 to 1 and from 3 to 7.