QUESTION IMAGE
Question
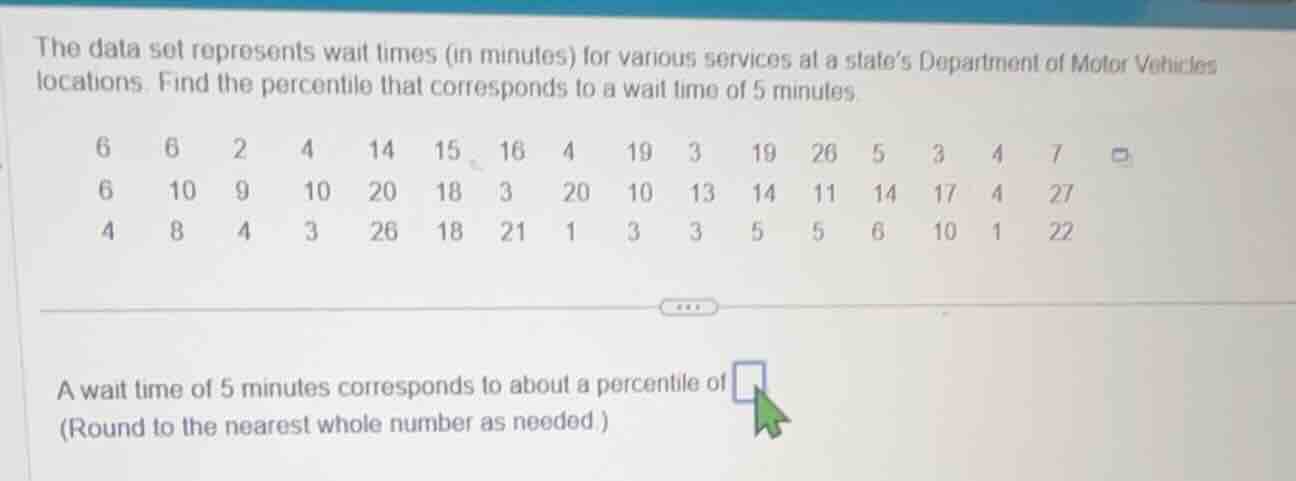
the data set represents wait times (in minutes) for various services at a states department of motor vehicles locations. find the percentile that corresponds to a wait time of 5 minutes.
6 6 2 4 14 15 16 4 19 3 19 26 5 3 4 7
6 10 9 10 20 18 3 20 10 13 14 11 14 17 4 27
4 8 4 3 26 18 21 1 3 3 5 5 6 10 1 22
a wait time of 5 minutes corresponds to about a percentile of
(round to the nearest whole number as needed.)
Step1: Count total data points
There are 45 data points, so $n=45$.
Step2: Sort data in ascending order
$1, 1, 2, 3, 3, 3, 3, 3, 4, 4, 4, 4, 4, 4, 5, 5, 5, 6, 6, 6, 6, 7, 8, 9, 10, 10, 10, 10, 11, 13, 14, 14, 14, 15, 16, 17, 18, 18, 19, 19, 20, 20, 21, 22, 26, 26, 27$
Step3: Count values ≤ 5
There are 17 values less than or equal to 5.
Step4: Calculate percentile
Use percentile formula: $\text{Percentile} = \frac{\text{Number of values } \leq x}{n} \times 100$
$\text{Percentile} = \frac{17}{45} \times 100 \approx 37.78$
Step5: Round to nearest whole number
Round 37.78 to 38.

Snap & solve any problem in the app
Get step-by-step solutions on Sovi AI
Photo-based solutions with guided steps
Explore more problems and detailed explanations
38