QUESTION IMAGE
Question
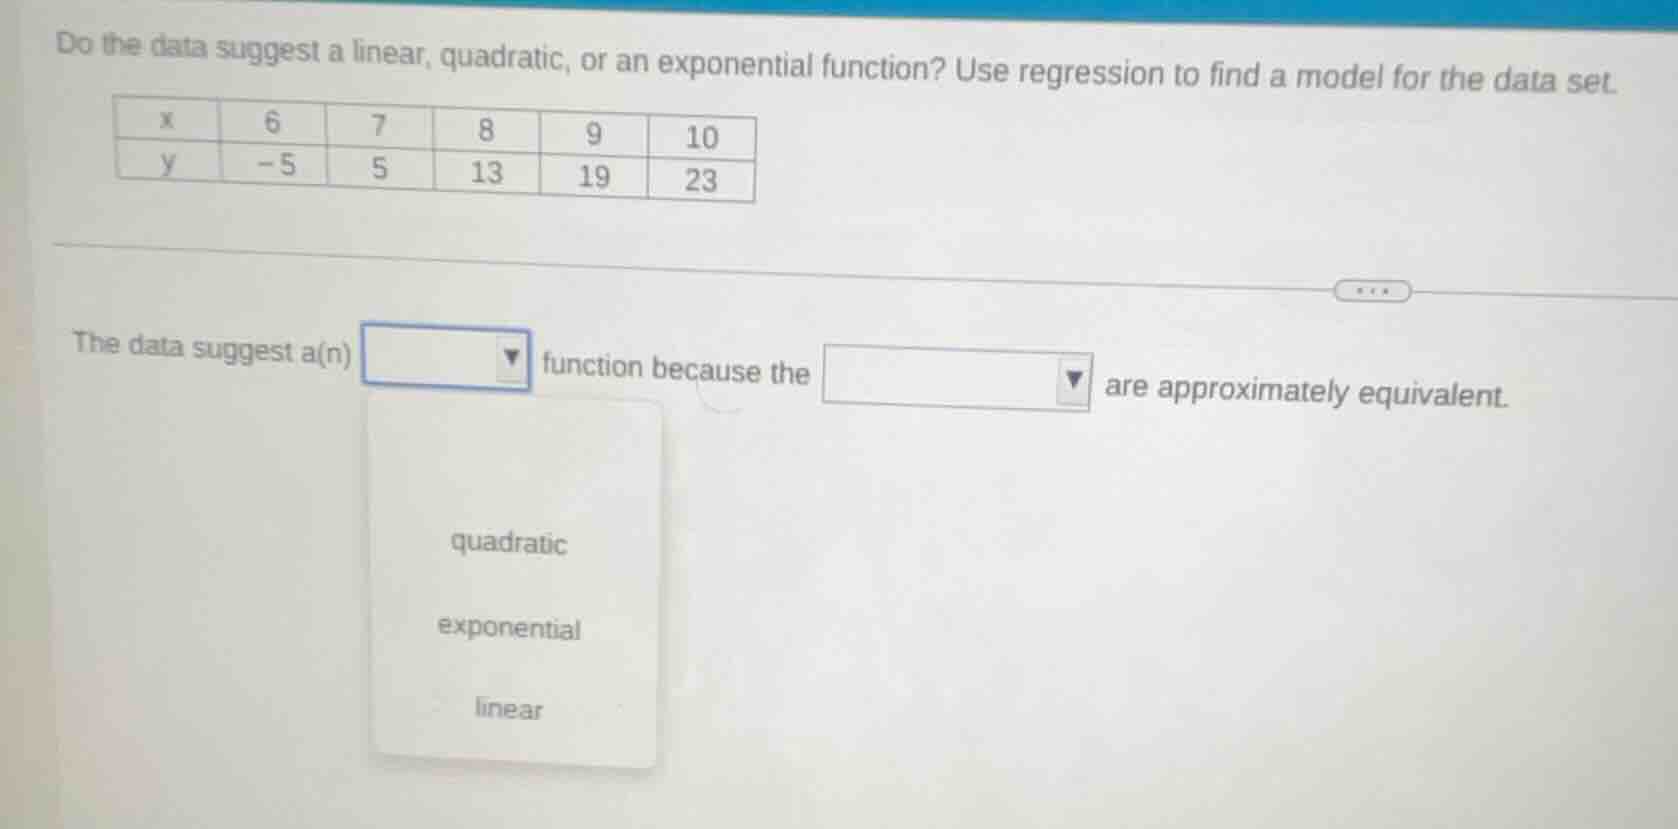
do the data suggest a linear, quadratic, or an exponential function? use regression to find a model for the data set.
x | 6 | 7 | 8 | 9 | 10
y | -5 | 5 | 13 | 19 | 23
the data suggest a(n) dropdown function because the dropdown are approximately equivalent.
dropdown options: quadratic, exponential, linear
Step1: Calculate first differences
$5 - (-5) = 10$, $13 - 5 = 8$, $19 - 13 = 6$, $23 - 19 = 4$
Step2: Calculate second differences
$8 - 10 = -2$, $6 - 8 = -2$, $4 - 6 = -2$
Step3: Identify function type
Second differences are constant, so the function is quadratic.
Step4: Find quadratic regression model
Use the form $y = ax^2 + bx + c$. Substitute data points to solve:
For $(6, -5)$: $36a + 6b + c = -5$
For $(7, 5)$: $49a + 7b + c = 5$
For $(8, 13)$: $64a + 8b + c = 13$
Subtract first from second: $13a + b = 10$
Subtract second from third: $15a + b = 8$
Subtract these two: $2a = -2 \implies a = -1$
Substitute $a=-1$ into $13a + b = 10$: $-13 + b = 10 \implies b = 23$
Substitute $a=-1, b=23$ into $36a + 6b + c = -5$: $-36 + 138 + c = -5 \implies c = -107$

Snap & solve any problem in the app
Get step-by-step solutions on Sovi AI
Photo-based solutions with guided steps
Explore more problems and detailed explanations
The data suggest a(n) quadratic function because the second differences are approximately equivalent.
The quadratic regression model is $y = -x^2 + 23x - 107$