QUESTION IMAGE
Question
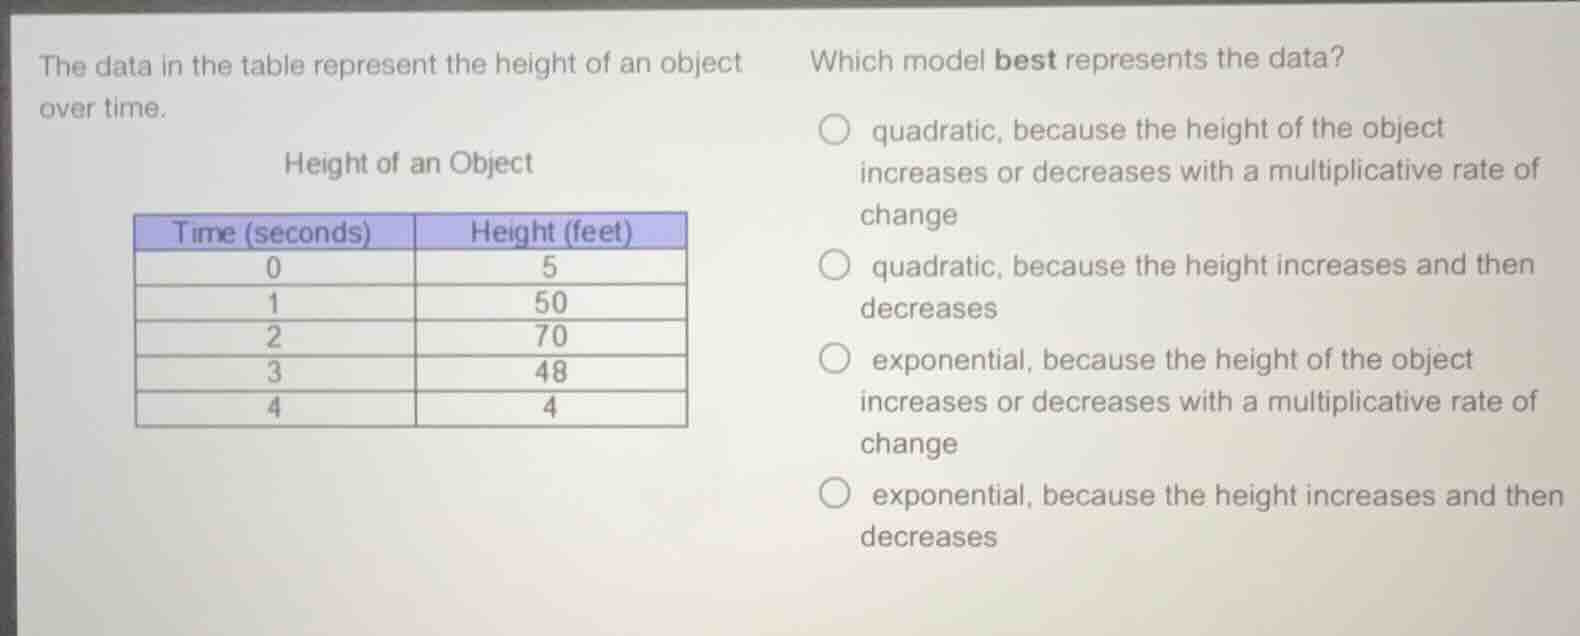
the data in the table represent the height of an object over time.
height of an object
time (seconds) | height (feet)
0 | 5
1 | 50
2 | 70
3 | 48
4 | 4
which model best represents the data?
○ quadratic, because the height of the object increases or decreases with a multiplicative rate of change
○ quadratic, because the height increases and then decreases
○ exponential, because the height of the object increases or decreases with a multiplicative rate of change
○ exponential, because the height increases and then decreases
First, analyze the data trend: height rises from 5 ft at 0s to 70 ft at 2s, then falls to 4 ft at 4s, forming a symmetric-like curve typical of quadratic models. Exponential models have consistent multiplicative growth/decay, which does not match this rise-then-fall pattern. The correct reasoning for quadratic is the increase then decrease of height.

Snap & solve any problem in the app
Get step-by-step solutions on Sovi AI
Photo-based solutions with guided steps
Explore more problems and detailed explanations
quadratic, because the height increases and then decreases