QUESTION IMAGE
Question
date ____ period __
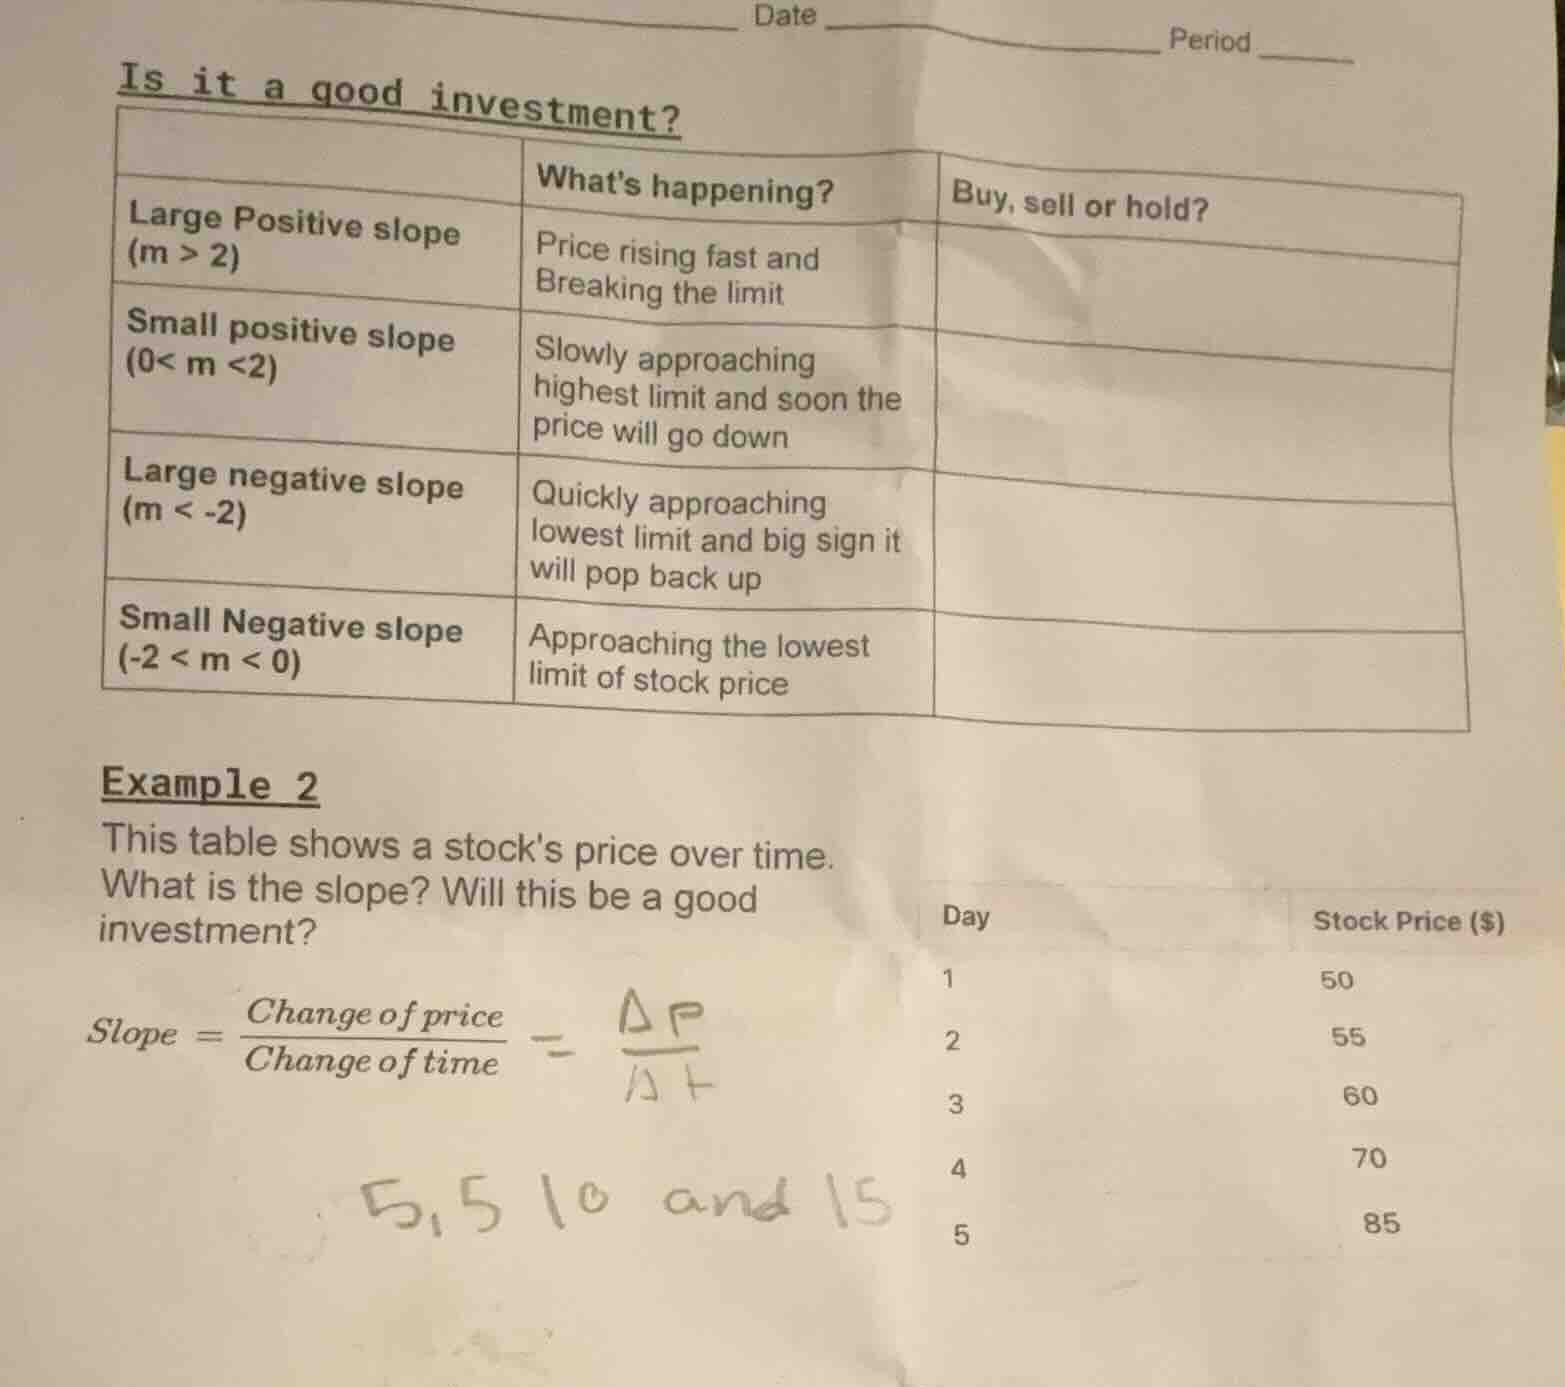
is it a good investment?
| whats happening? | buy, sell or hold? | |
| large positive slope (m > 2) | price rising fast and breaking the limit | |
| small positive slope (0< m <2) | slowly approaching highest limit and soon the price will go down | |
| large negative slope (m < -2) | quickly approaching lowest limit and big sign it will pop back up | |
| small negative slope (-2 < m < 0) | approaching the lowest limit of stock price |
example 2
this table shows a stocks price over time.
what is the slope? will this be a good investment?
slope = \\(\frac{change\\,of\\,price}{change\\,of\\,time}\\) = \\(\frac{\delta p}{\delta t}\\)
| day | stock price ($) |
| 1 | 50 |
| 2 | 55 |
| 3 | 60 |
| 4 | 70 |
| 5 | 85 |
Step1: Calculate the slope
We use the formula for slope \( m=\frac{\Delta P}{\Delta t} \), where \( \Delta P \) is the change in price and \( \Delta t \) is the change in time. Let's take two points, say \( (t_1, P_1)=(1, 50) \) and \( (t_2, P_2)=(5, 85) \). Then \( \Delta P = 85 - 50=35 \) and \( \Delta t = 5 - 1 = 4 \). So \( m=\frac{35}{4}=8.75 \).
Step2: Determine the investment decision
Since \( m = 8.75>2 \), it has a large positive slope. From the table, when there is a large positive slope (price rising fast and breaking the limit), the decision is to buy.

Snap & solve any problem in the app
Get step-by-step solutions on Sovi AI
Photo-based solutions with guided steps
Explore more problems and detailed explanations
The slope is \( 8.75 \), and it is a good investment (decision: Buy).