QUESTION IMAGE
Question
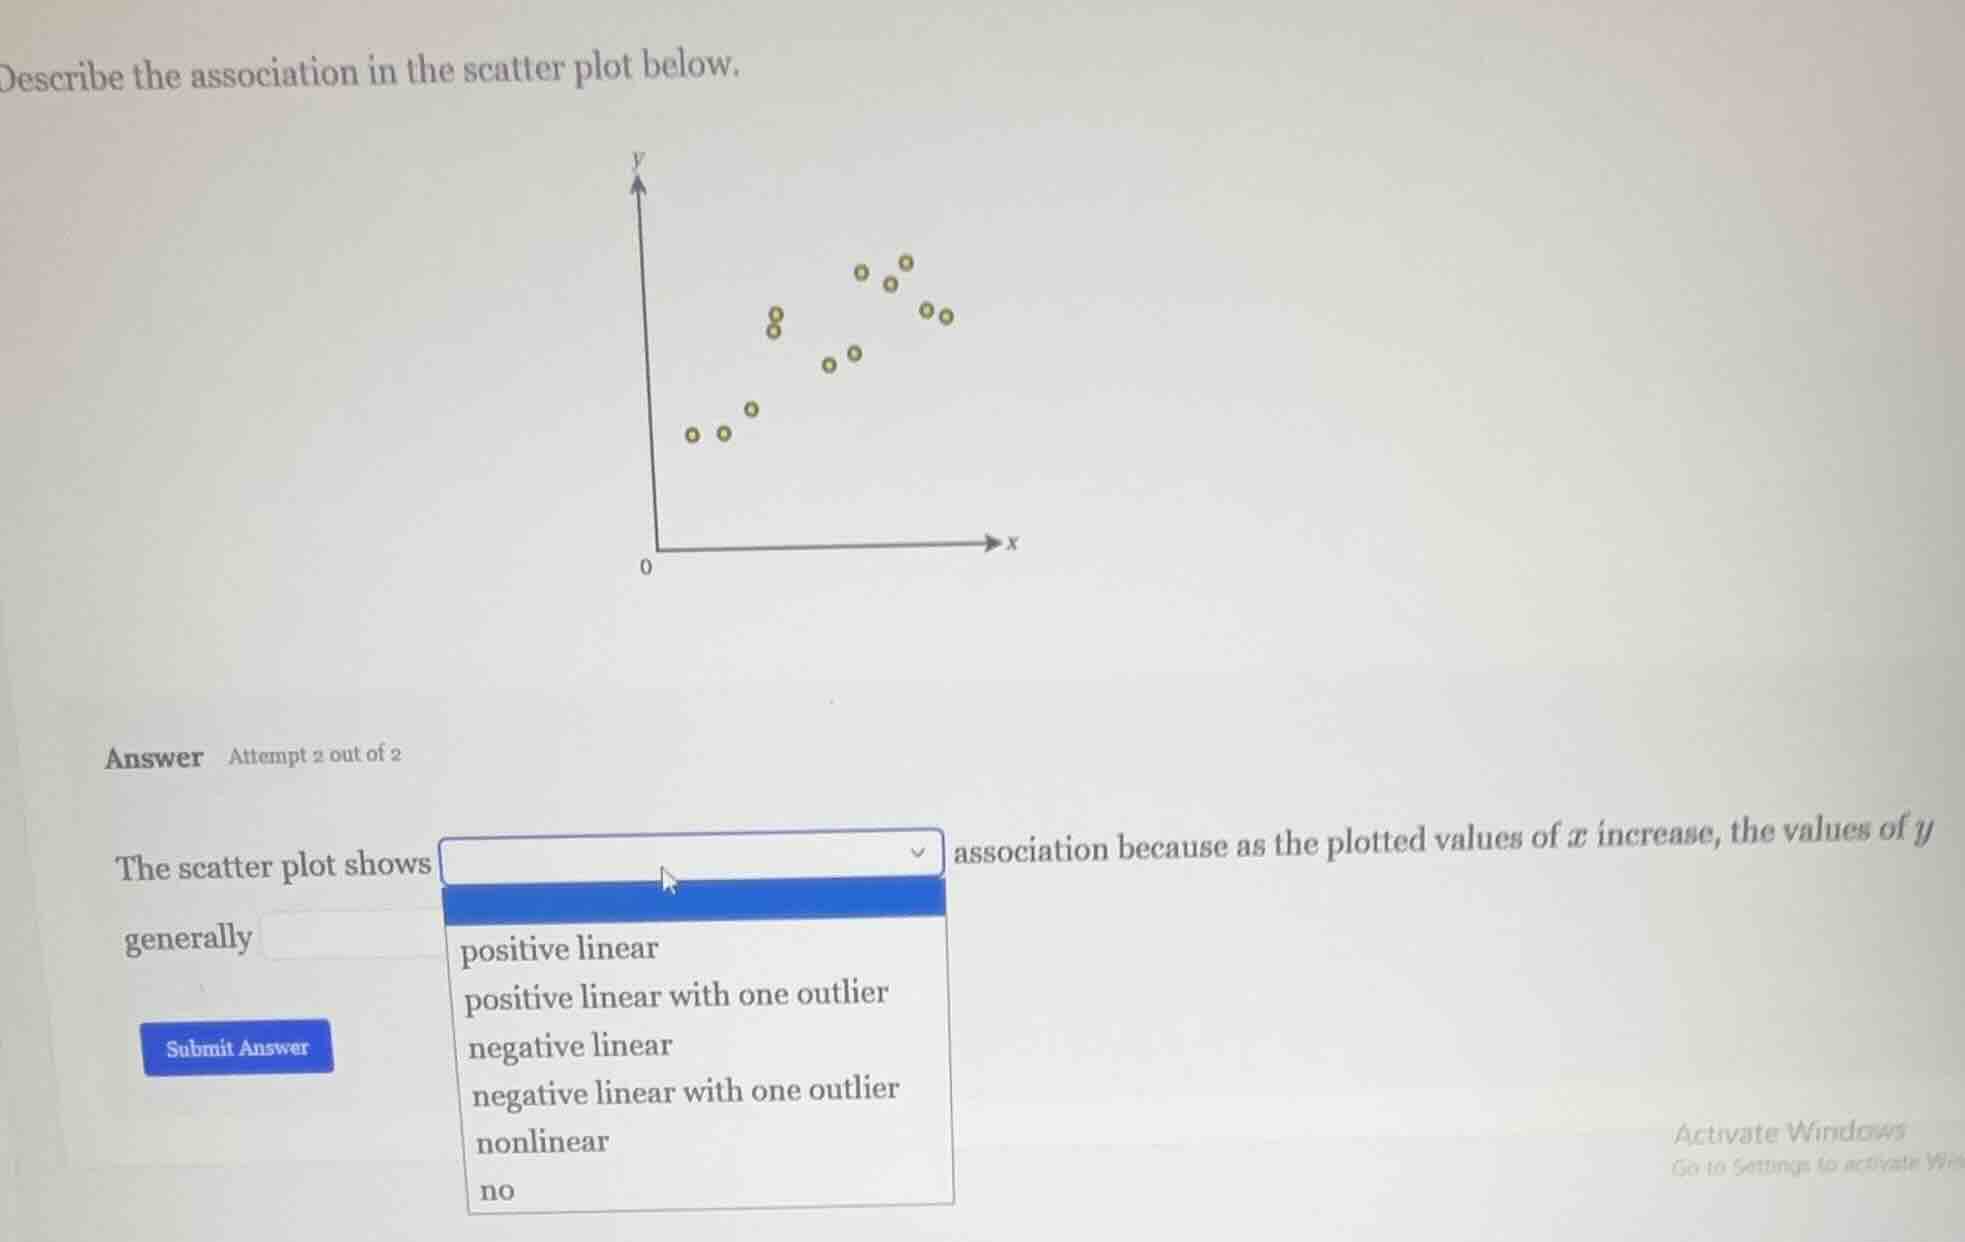
describe the association in the scatter plot below.
answer attempt 2 out of 2
the scatter plot shows association because as the plotted values of ( x ) increase, the values of ( y ) generally
positive linear
positive linear with one outlier
negative linear
negative linear with one outlier
nonlinear
no
submit answer
Brief Explanations
As the x-values increase, the y-values also increase in a roughly straight, upward-trending pattern with no points that deviate sharply from this trend.

Snap & solve any problem in the app
Get step-by-step solutions on Sovi AI
Photo-based solutions with guided steps
Explore more problems and detailed explanations
positive linear