QUESTION IMAGE
Question
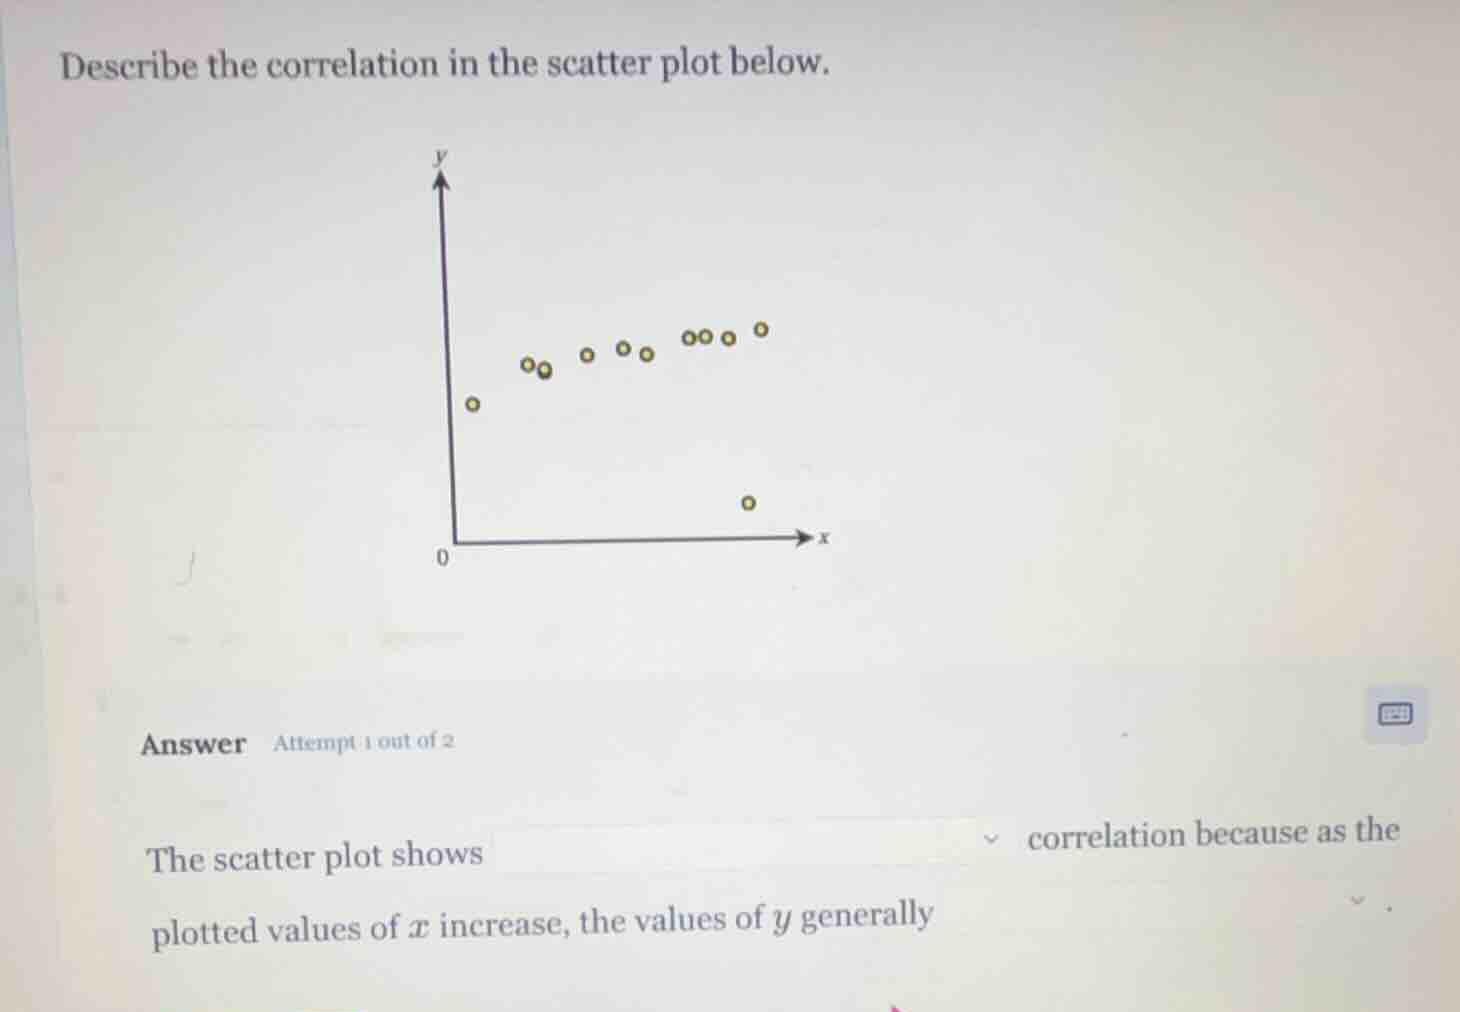
describe the correlation in the scatter plot below.
answer attempt 1 out of 2
the scatter plot shows correlation because as the
plotted values of $x$ increase, the values of $y$ generally
Most data points follow a trend where as x increases, y also increases, with one outlier that does not change the overall positive direction of the relationship. The upward trend is moderate as the points are somewhat clustered but not tightly aligned.

Snap & solve any problem in the app
Get step-by-step solutions on Sovi AI
Photo-based solutions with guided steps
Explore more problems and detailed explanations
The scatter plot shows a positive (moderate) correlation because as the plotted values of $x$ increase, the values of $y$ generally increase (with one outlier that does not override the overall trend).