QUESTION IMAGE
Question
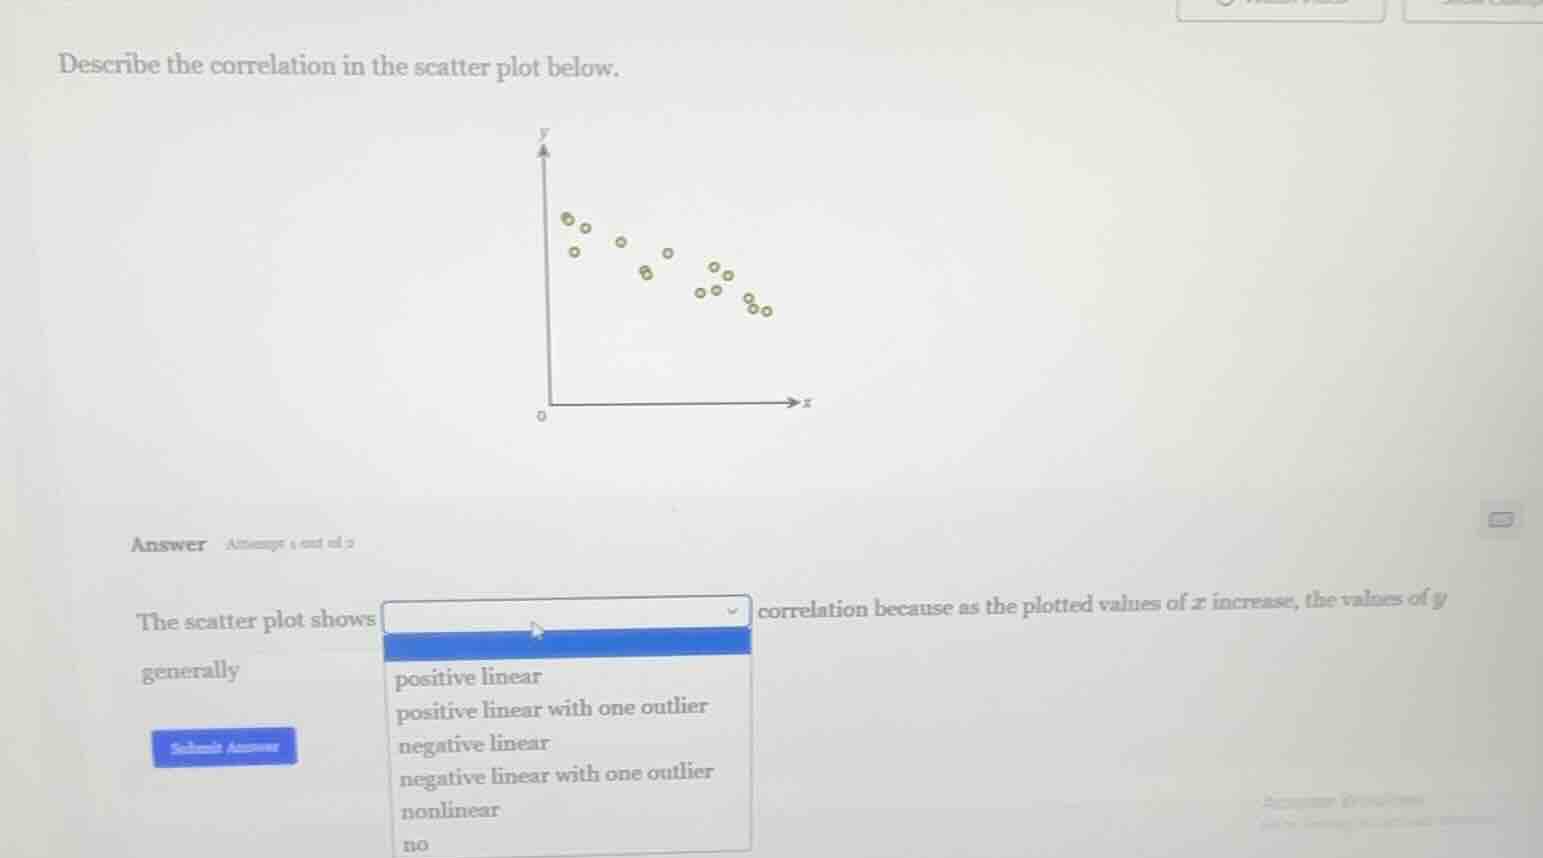
describe the correlation in the scatter plot below.
the scatter plot shows dropdown correlation because as the plotted values of x increase, the values of y generally
dropdown options: positive linear, positive linear with one outlier, negative linear, negative linear with one outlier, nonlinear, no
Brief Explanations
As the x-values increase, the y-values show a consistent downward linear trend. All points follow this pattern without a clear outlier, so it is a negative linear correlation.

Snap & solve any problem in the app
Get step-by-step solutions on Sovi AI
Photo-based solutions with guided steps
Explore more problems and detailed explanations
negative linear