QUESTION IMAGE
Question
descriptive statistics
part 2 of 2
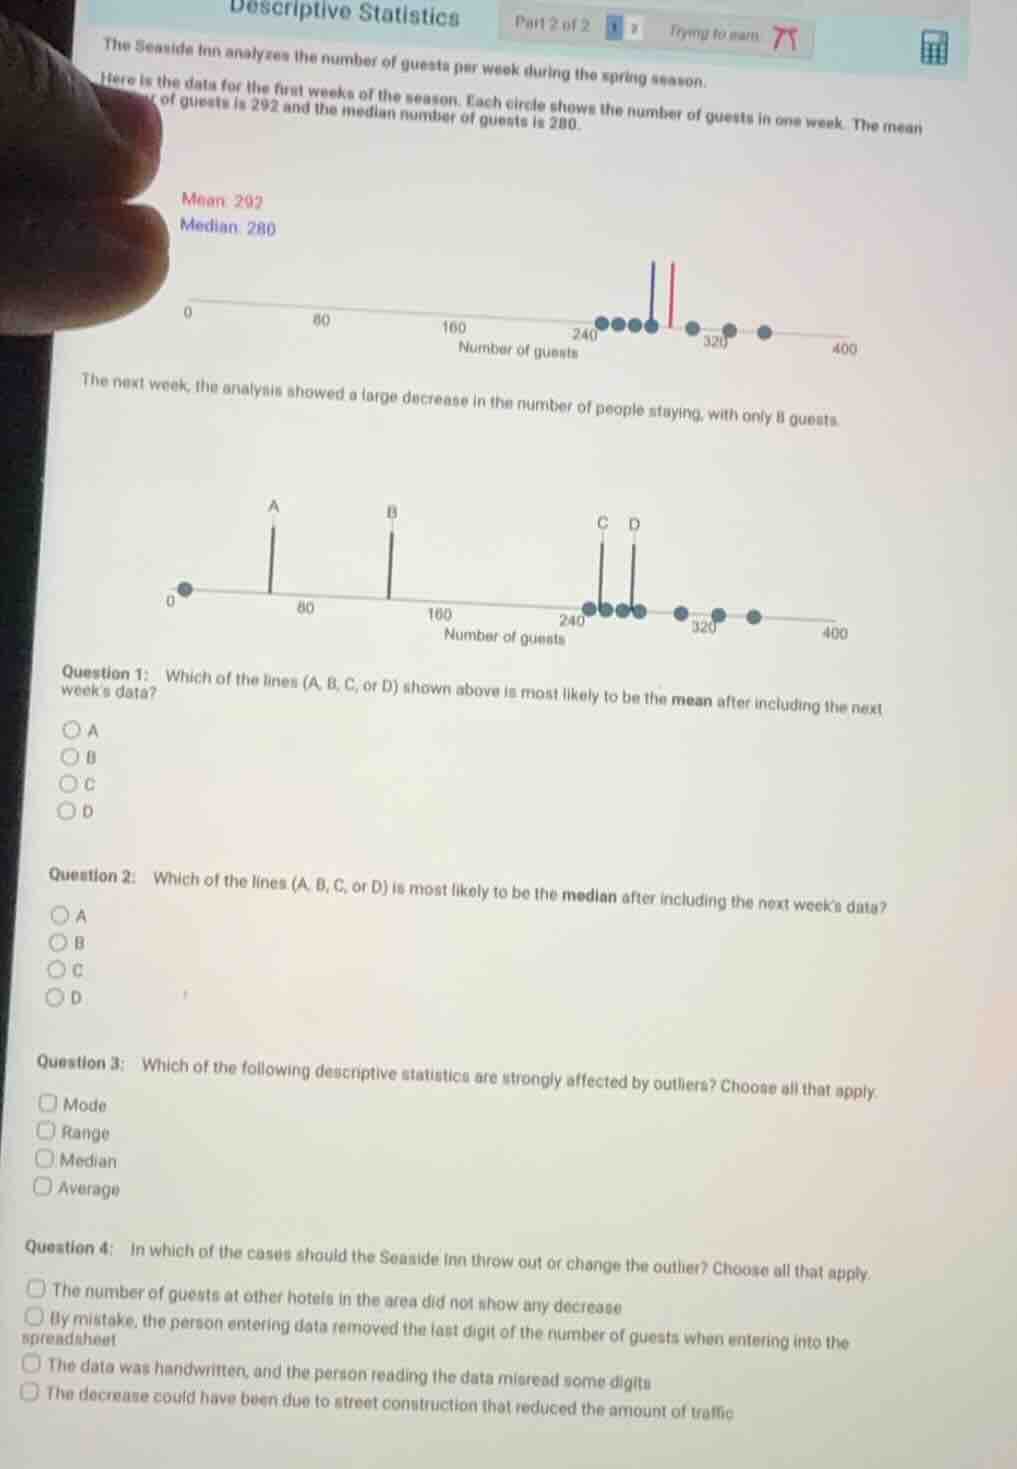
the seaside inn analyzes the number of guests per week during the spring season.
here is the data for the first weeks of the season. each circle shows the number of guests in one week. the mean of guests is 292 and the median number of guests is 280.
mean: 292
median: 280
0 80 160 240 320 400
number of guests
the next week, the analysis showed a large decrease in the number of people staying, with only 8 guests.
0 a b c d 80 100 240 320 400
number of guests
question 1: which of the lines (a, b, c, or d) shown above is most likely to be the mean after including the next week’s data?
○ a
○ b
○ c
○ d
question 2: which of the lines (a, b, c, or d) is most likely to be the median after including the next week’s data?
○ a
○ b
○ c
○ d
question 3: which of the following descriptive statistics are strongly affected by outliers? choose all that apply.
□ mode
□ range
□ median
□ average
question 4: in which of the cases should the seaside inn throw out or change the outlier? choose all that apply.
□ the number of guests at other hotels in the area did not show any decrease
□ by mistake, the person entering data removed the last digit of the number of guests when entering into the spreadsheet
□ the data was handwritten, and the person reading the data misread some digits
□ the decrease could have been due to street construction that reduced the amount of traffic
Step1: Analyze mean change (Q1)
Original mean is 292. Adding an outlier (8, much lower) will pull the mean down, but it won't drop as far as the outlier. The original data clusters near 240-320, so the new mean will be between 8 and 280, closer to the original cluster but lower than 292. Line C is the only one in this range.
Step2: Analyze median change (Q2)
Original median is 280. Count original data points: 7 points. Adding 1 more makes 8 points. The median is the average of the 4th and 5th values when sorted. The original 4th value is 280, and the new lowest value (8) doesn't shift the 4th and 5th values from their original positions near 280. So the median stays near 280, which matches line D.
Step3: Identify outlier-sensitive stats (Q3)
- Mode: Unchanged by outliers (most frequent value).
- Range: Calculated as $\text{Max}-\text{Min}$, so an outlier changes min/max drastically.
- Median: Resistant to outliers (only depends on middle values).
- Average (mean): Pulled toward outliers, strongly affected.
Step4: Determine valid outlier removal (Q4)
Outliers should only be removed if they are data entry errors.
- "Other hotels had no decrease" is not a valid reason (this inn could be an exception).
- "Removed last digit" is a data entry error, valid to correct.
- "Misread digits" is a data entry error, valid to correct.
- "Street construction" is a real event, so the outlier is valid data, not to be removed.

Snap & solve any problem in the app
Get step-by-step solutions on Sovi AI
Photo-based solutions with guided steps
Explore more problems and detailed explanations
Question 1: C
Question 2: D
Question 3: Range, Average
Question 4: By mistake, the person entering data removed the last digit of the number of guests when entering into the spreadsheet; The data was handwritten, and the person reading the data misread some digits