QUESTION IMAGE
Question
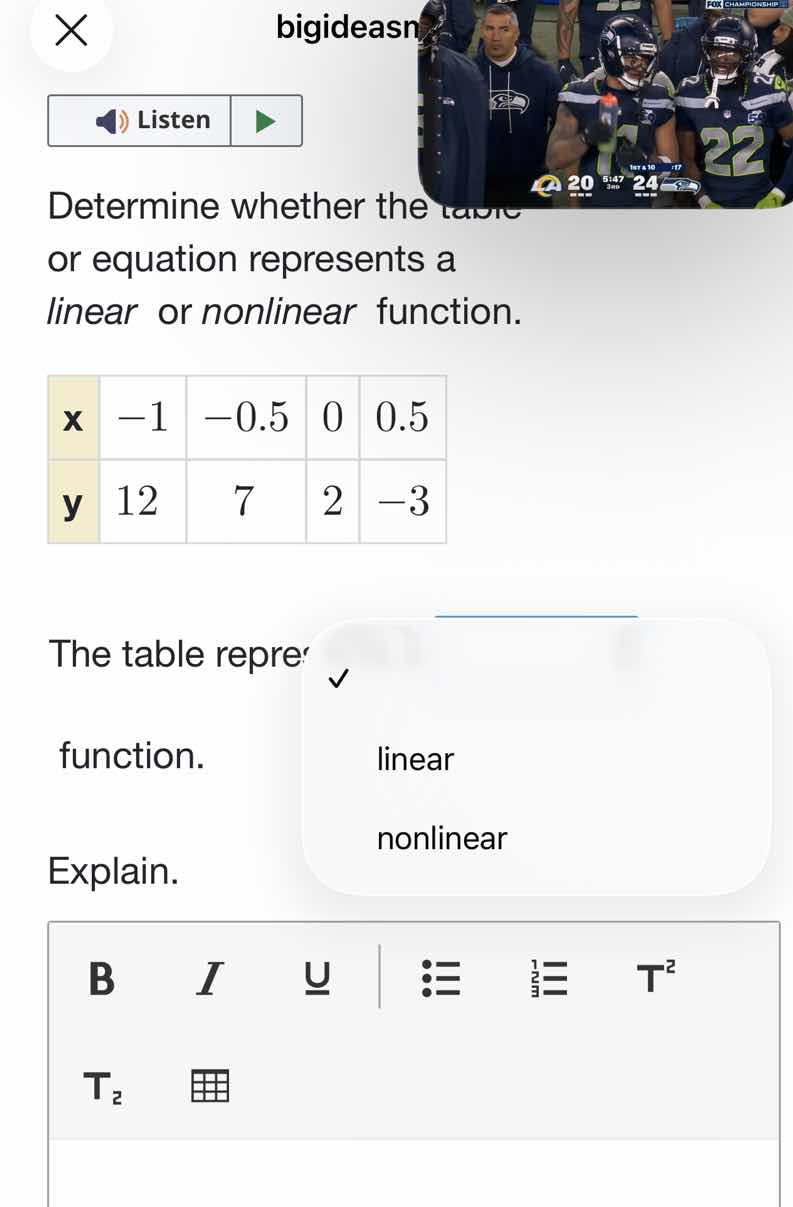
determine whether the table or equation represents a linear or nonlinear function.
x -1 -0.5 0 0.5
y 12 7 2 -3
the table repre function.
explain.
linear
nonlinear
Step1: Calculate x differences
$\Delta x_1 = -0.5 - (-1) = 0.5$
$\Delta x_2 = 0 - (-0.5) = 0.5$
$\Delta x_3 = 0.5 - 0 = 0.5$
Step2: Calculate y differences
$\Delta y_1 = 7 - 12 = -5$
$\Delta y_2 = 2 - 7 = -5$
$\Delta y_3 = -3 - 2 = -5$
Step3: Check rate of change
$\frac{\Delta y_1}{\Delta x_1} = \frac{-5}{0.5} = -10$
$\frac{\Delta y_2}{\Delta x_2} = \frac{-5}{0.5} = -10$
$\frac{\Delta y_3}{\Delta x_3} = \frac{-5}{0.5} = -10$

Snap & solve any problem in the app
Get step-by-step solutions on Sovi AI
Photo-based solutions with guided steps
Explore more problems and detailed explanations
linear
The table represents a linear function because the ratio of the constant change in $y$ to the constant change in $x$ is consistent (a constant slope of $-10$) across all pairs of points.