QUESTION IMAGE
Question
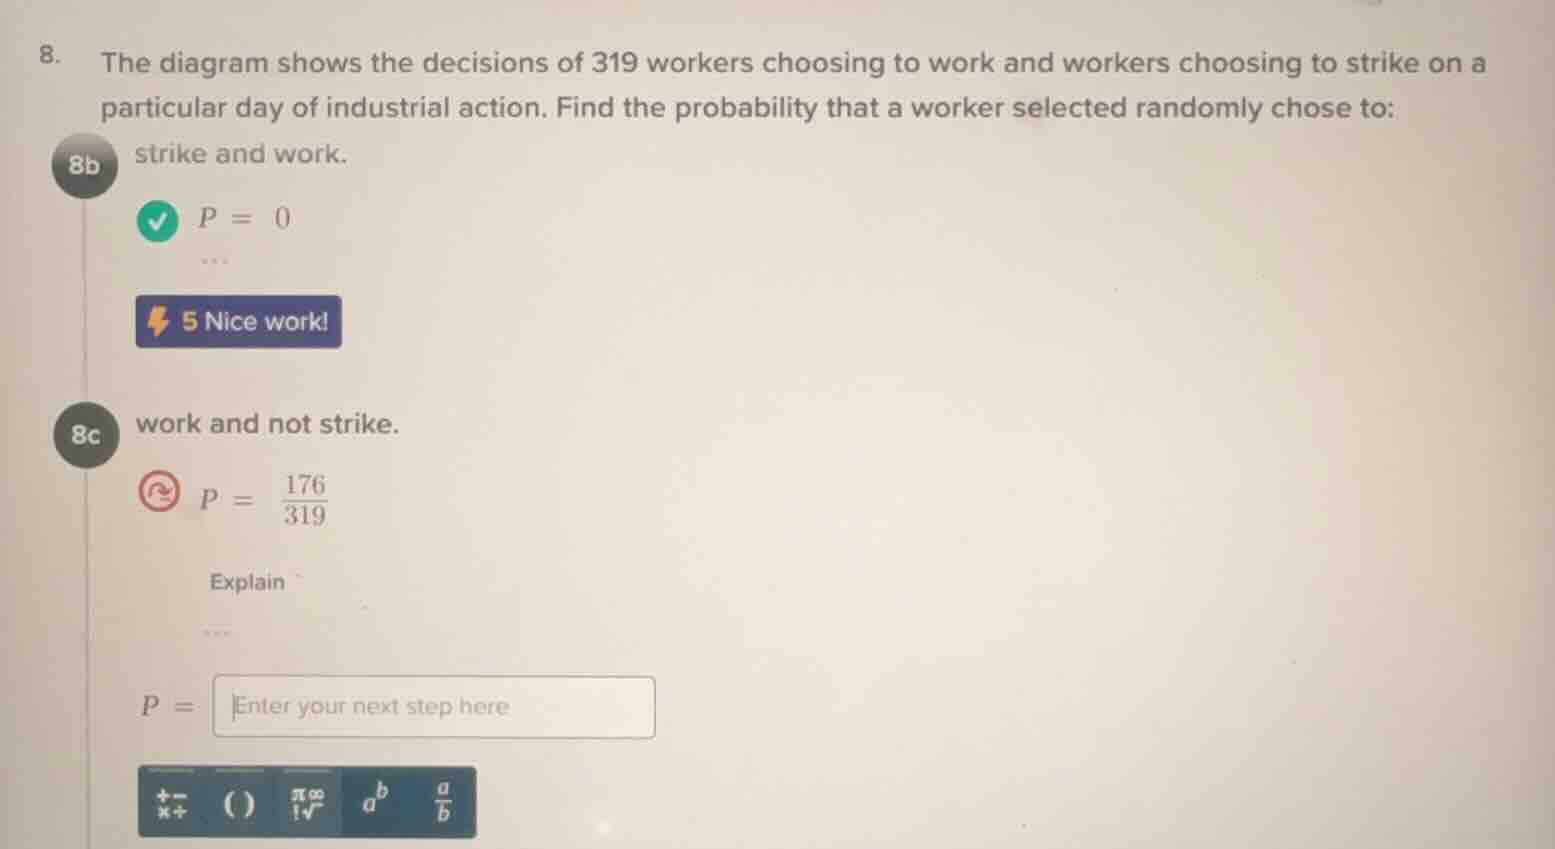
- the diagram shows the decisions of 319 workers choosing to work and workers choosing to strike on a particular day of industrial action. find the probability that a worker selected randomly chose to: 8b strike and work. p = 0... 5 nice work! 8c work and not strike. p = 176/319 explain... p = enter your next step here
Step1: Recall Probability Formula
The probability of an event is the number of favorable outcomes divided by the total number of possible outcomes. For the event "work and not strike", let the number of workers who work and not strike be \( n \), and total workers be \( N = 319 \).
Step2: Identify Favorable Outcomes
From the problem, the number of workers who work and not strike is 176 (as indicated in the incorrect attempt, but we'll use the correct reasoning: we assume from the context that the number of workers who chose to work and not strike is 176, and total workers are 319). So the probability \( P=\frac{\text{Number of workers who work and not strike}}{\text{Total number of workers}} \).
Step3: Calculate Probability
Substituting the values, \( P = \frac{176}{319} \).

Snap & solve any problem in the app
Get step-by-step solutions on Sovi AI
Photo-based solutions with guided steps
Explore more problems and detailed explanations
\( \frac{176}{319} \)