QUESTION IMAGE
Question
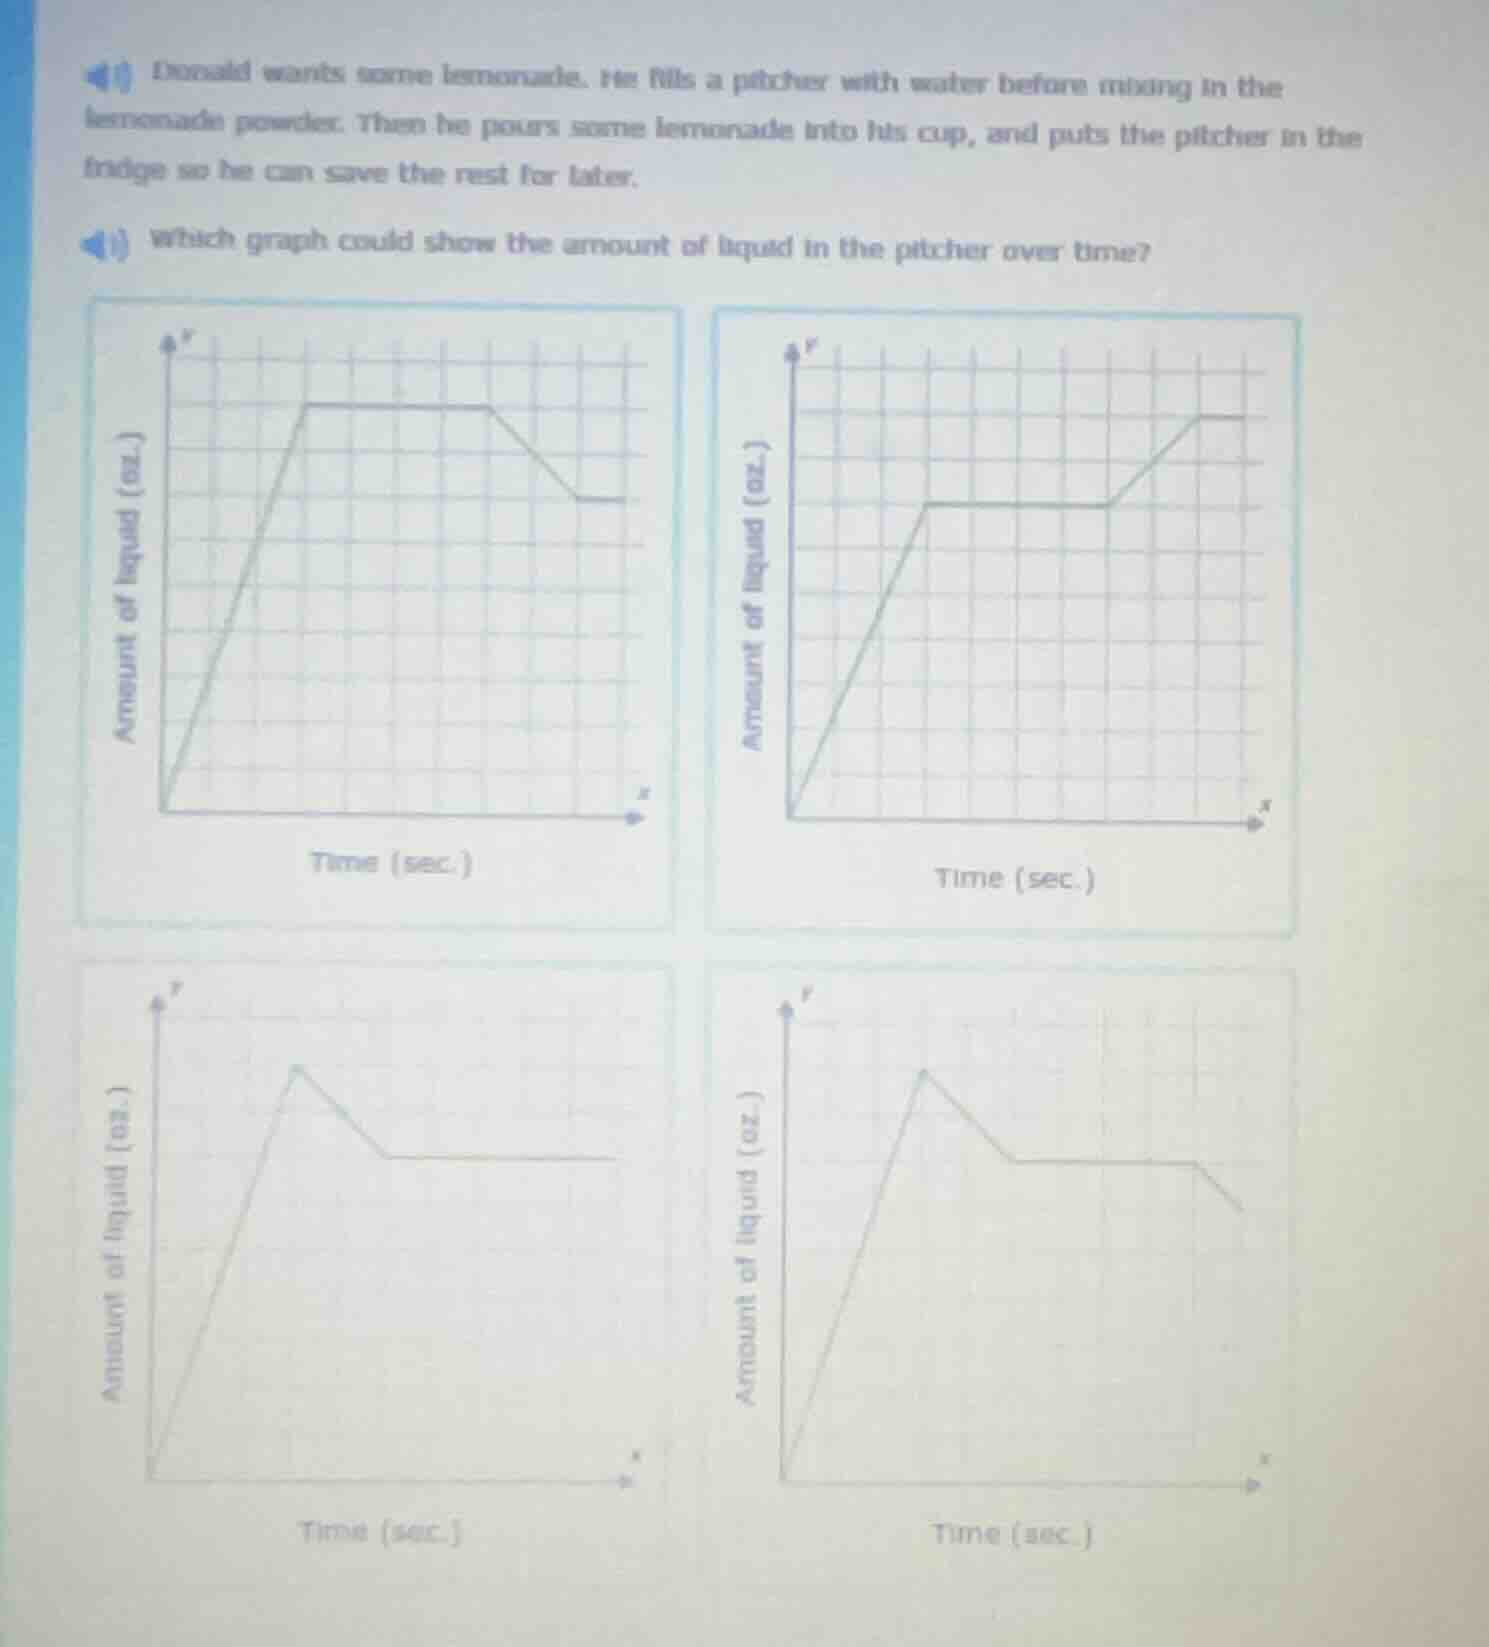
donald wants some lemonade. he fills a pitcher with water before mixing in the lemonade powder. then he pours some lemonade into his cup, and puts the pitcher in the fridge so he can save the rest for later. which graph could show the amount of liquid in the pitcher over time?
Brief Explanations
- First, Donald fills the pitcher with water: the amount of liquid in the pitcher increases steadily over time, matching the rising line at the start of the graphs.
- Next, he mixes in lemonade powder (no change in liquid amount) and then lets the pitcher sit before pouring a cup: the liquid amount stays constant, matching the flat horizontal line segment.
- Finally, he pours some lemonade into his cup: the amount of liquid in the pitcher decreases steadily, then stays constant once he stops pouring (the remaining lemonade is stored in the fridge).
- Only the top-left graph follows this sequence: rise → constant → fall → constant.

Snap & solve any problem in the app
Get step-by-step solutions on Sovi AI
Photo-based solutions with guided steps
Explore more problems and detailed explanations
The top-left graph (with the sequence: increasing liquid, constant liquid, decreasing liquid, constant liquid)