QUESTION IMAGE
Question
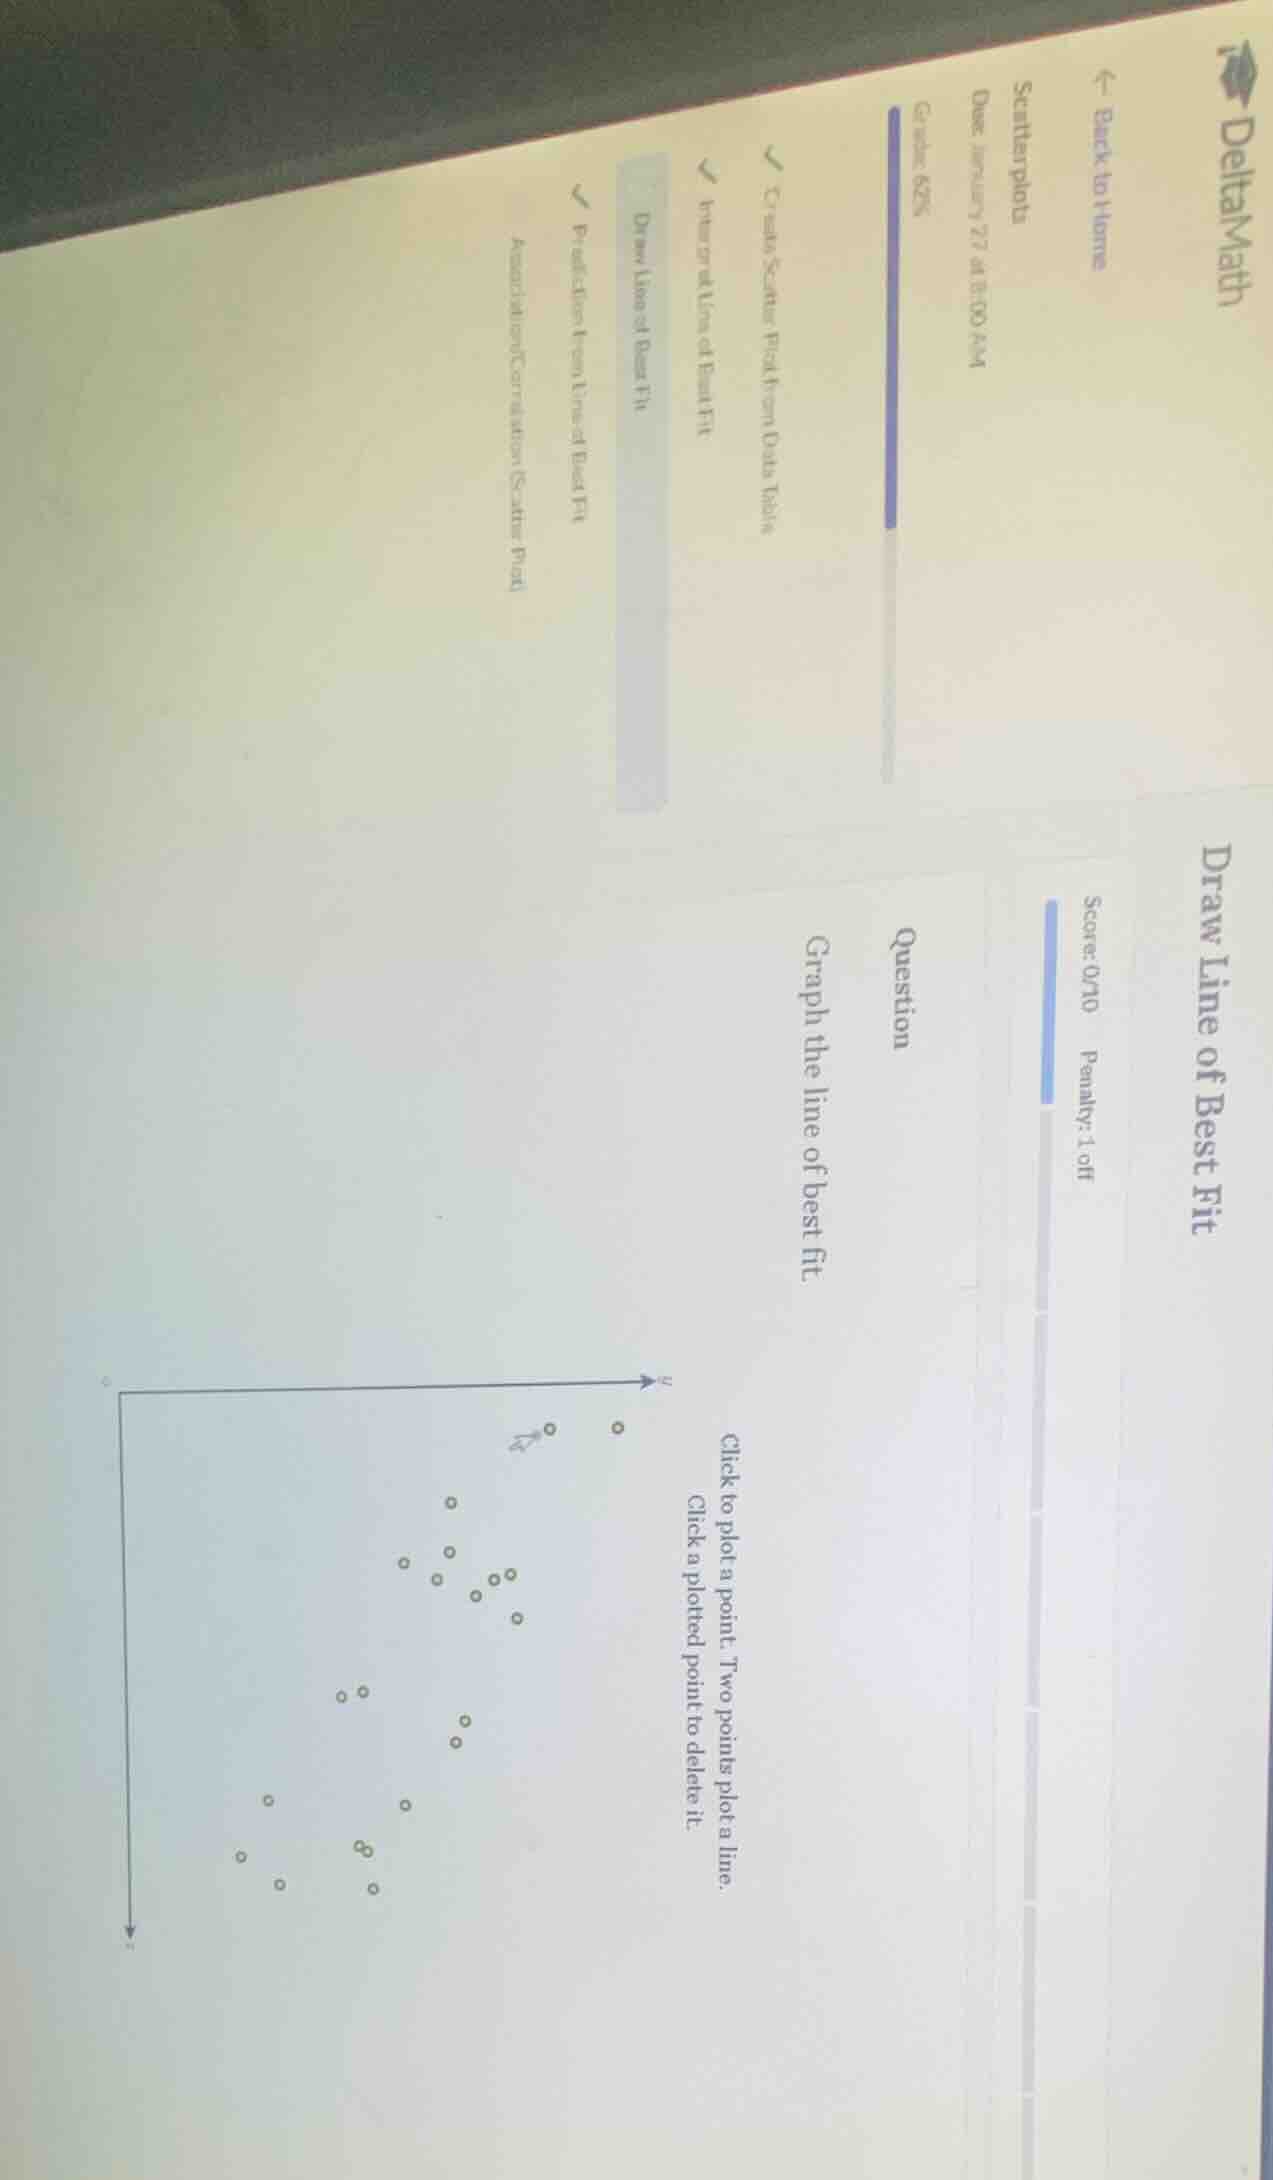
draw line of best fit
score: 0/10 penalty: 1 off
question
graph the line of best fit.
click to plot a point. two points plot a line.
click a plotted point to delete it.
Step1: Analyze the scatter plot's trend
Observe the general direction of the data points. They seem to have a positive correlation (as x increases, y generally increases).
Step2: Identify two representative points
Find two points that are close to the center of the data cluster. For example, pick a point from the lower - left cluster and a point from the upper - right cluster that seem to lie along the trend.
Step3: Draw the line
Connect the two chosen points with a straight line. This line should pass through the middle of the data points, balancing the number of points above and below the line as much as possible.

Snap & solve any problem in the app
Get step-by-step solutions on Sovi AI
Photo-based solutions with guided steps
Explore more problems and detailed explanations
To draw the line of best fit, follow these steps:
- Identify the general trend of the scatter plot (positive in this case, as y - values tend to increase with x - values).
- Select two points that lie close to the center of the data distribution. For example, if we consider the lower - left and upper - right regions of the data cluster, pick a point like (x₁,y₁) from the lower - left and (x₂,y₂) from the upper - right where the points are representative of the overall trend.
- Use a straight - edge (or the plotting tool) to draw a line connecting these two points. The line should be positioned such that it approximately balances the number of data points above and below it.
(Note: Since this is a drawing task, the final answer is the visual line of best fit drawn through the scatter plot points following the above steps.)