QUESTION IMAGE
Question
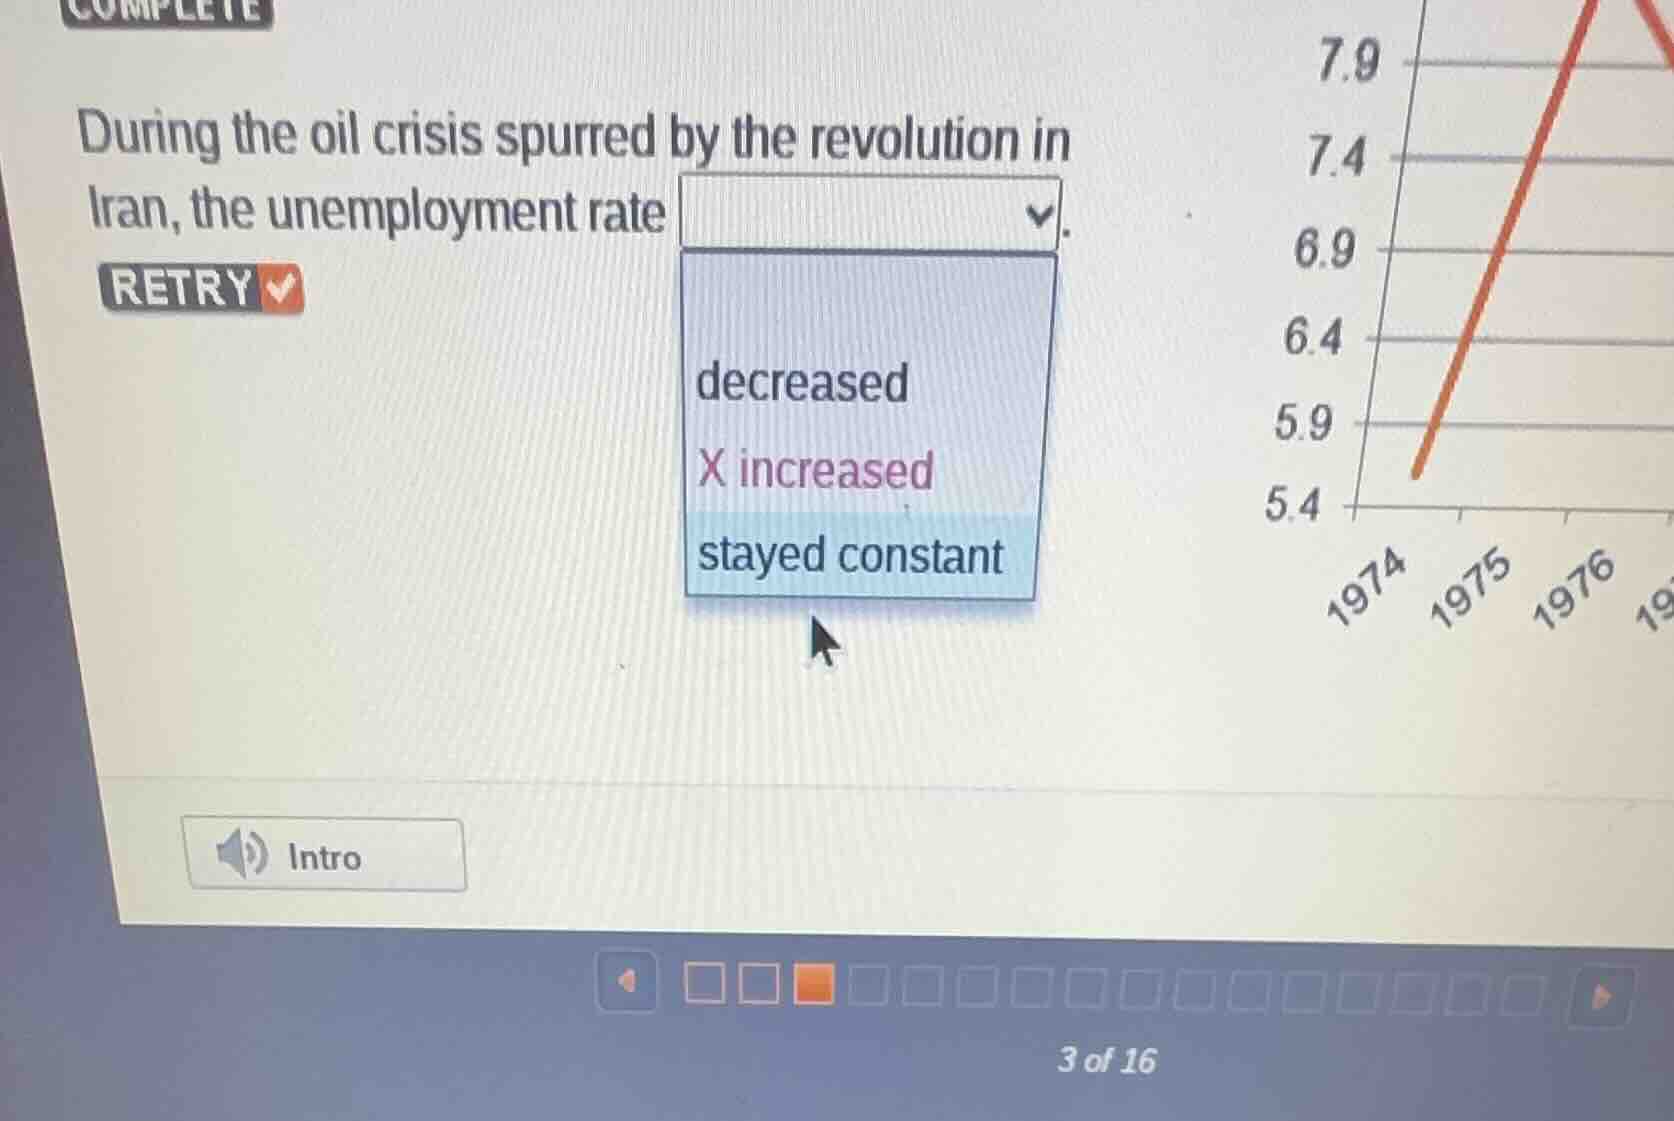
during the oil crisis spurred by the revolution in iran, the unemployment rate dropdown with options: decreased, increased (marked with x), stayed constant. there is a chart on the right with years 1974, 1975, 1976 and unemployment rate values 5.4, 5.9, 6.4, 6.9, 7.4, 7.9 and a red line trend.
Brief Explanations
The line graph on the right shows a sharp upward trend in the value (unemployment rate) from 1974 onward, which aligns with the timeline of the Iranian Revolution oil crisis (late 1970s). The upward line indicates the rate rose.

Snap & solve any problem in the app
Get step-by-step solutions on Sovi AI
Photo-based solutions with guided steps
Explore more problems and detailed explanations
increased