QUESTION IMAGE
Question
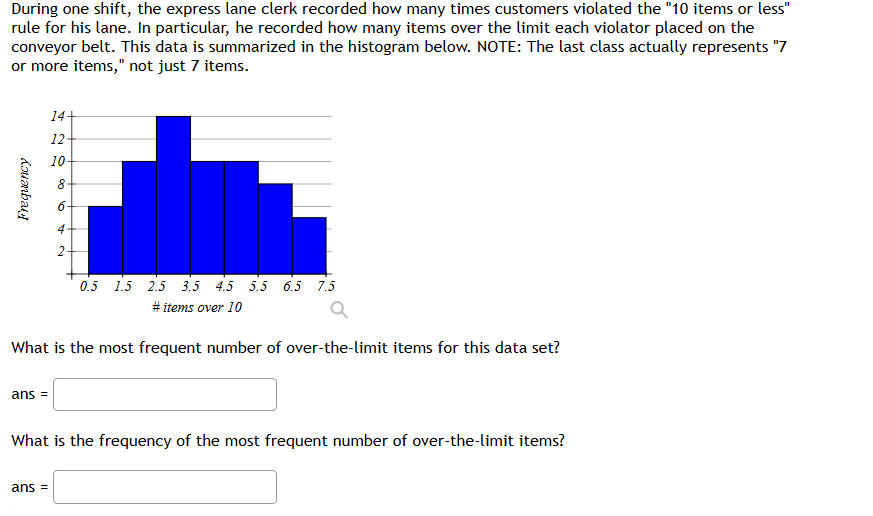
during one shift, the express lane clerk recorded how many times customers violated the \10 items or less\ rule for his lane. in particular, he recorded how many items over the limit each violator placed on the conveyor belt. this data is summarized in the histogram below. note: the last class actually represents \7 or more items,\ not just 7 items.
what is the most frequent number of over - the - limit items for this data set?
ans =
what is the frequency of the most frequent number of over - the - limit items?
ans =
First Sub - Question: What is the most frequent number of over - the - limit items for this data set?
Step1: Analyze the histogram
In a histogram, the class with the highest frequency (tallest bar) corresponds to the most frequent range of values. The x - axis labels are the mid - points or the range of the number of items over 10. The bar with the highest height is centered around 3 (since the class is from 2.5 to 3.5, and the mid - point is 3). So we look at the class intervals. The class interval with the highest frequency (tallest bar) is the one from 2.5 to 3.5, and the mid - value (or the typical value in this class) for the number of over - the - limit items is 3.
Step1: Identify the tallest bar
From the histogram, the tallest bar has a frequency (y - axis value) of 14. We can see that the y - axis for the tallest bar reaches up to 14. So we just read the height of the tallest bar from the y - axis.

Snap & solve any problem in the app
Get step-by-step solutions on Sovi AI
Photo-based solutions with guided steps
Explore more problems and detailed explanations
3