QUESTION IMAGE
Question
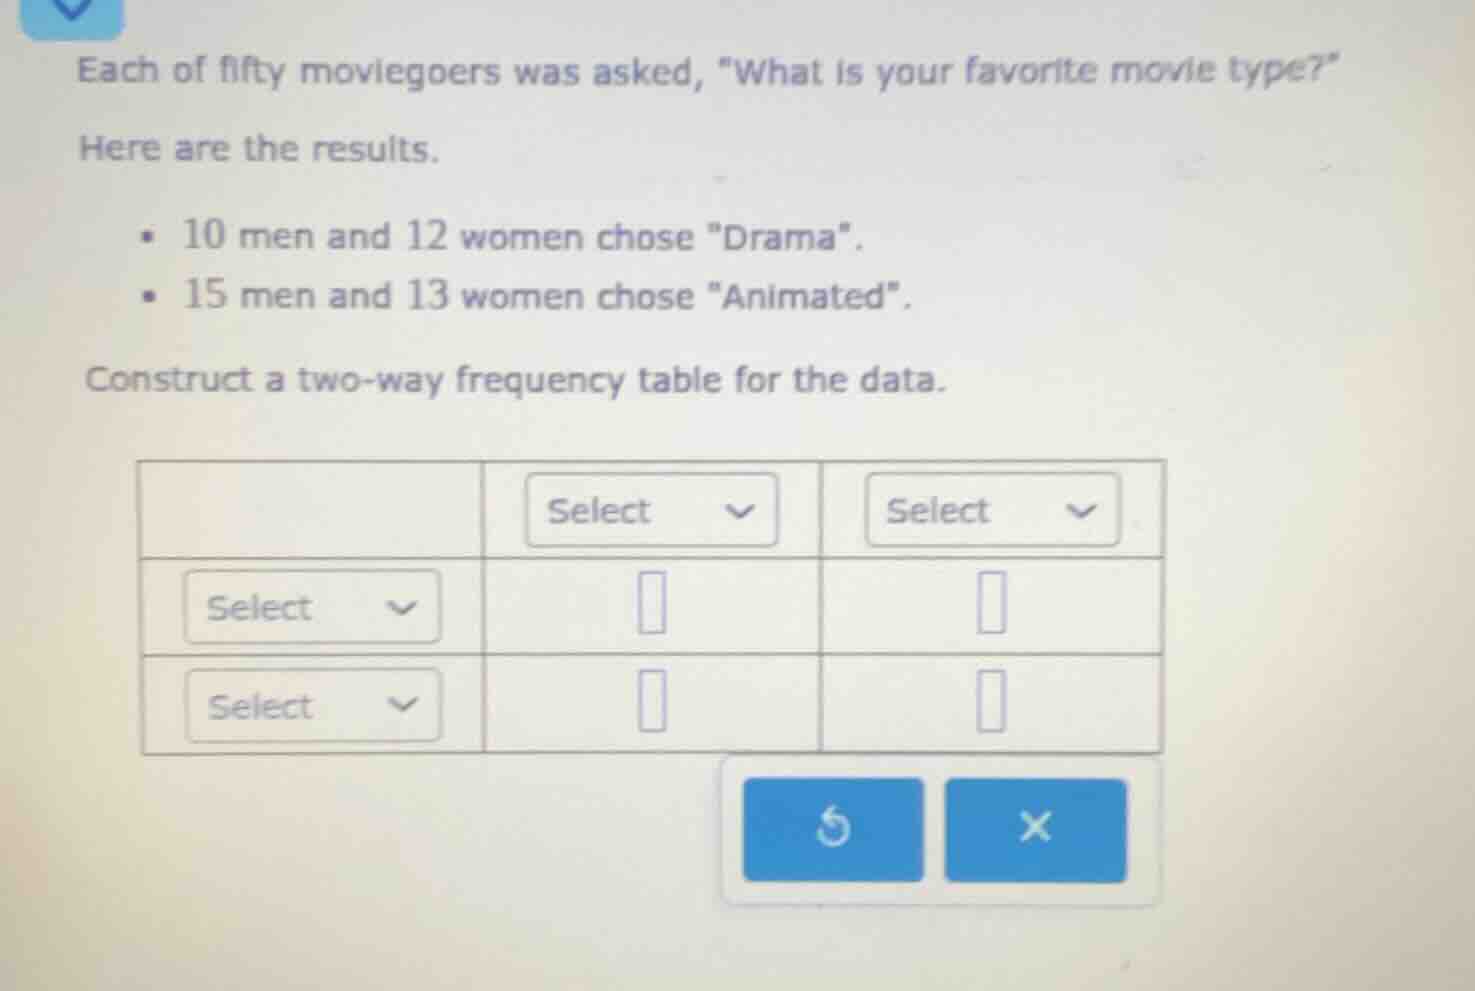
each of fifty moviegoers was asked, \what is your favorite movie type?\ here are the results. - 10 men and 12 women chose \drama\. - 15 men and 13 women chose \animated\. construct a two - way frequency table for the data.
Step1: Define table categories
Rows: Gender (Men, Women); Columns: Movie Type (Drama, Animated)
Step2: Fill Drama column values
Men: $10$, Women: $12$
Step3: Fill Animated column values
Men: $15$, Women: $13$

Snap & solve any problem in the app
Get step-by-step solutions on Sovi AI
Photo-based solutions with guided steps
Explore more problems and detailed explanations
| Drama | Animated | |
|---|---|---|
| Women | 12 | 13 |