QUESTION IMAGE
Question
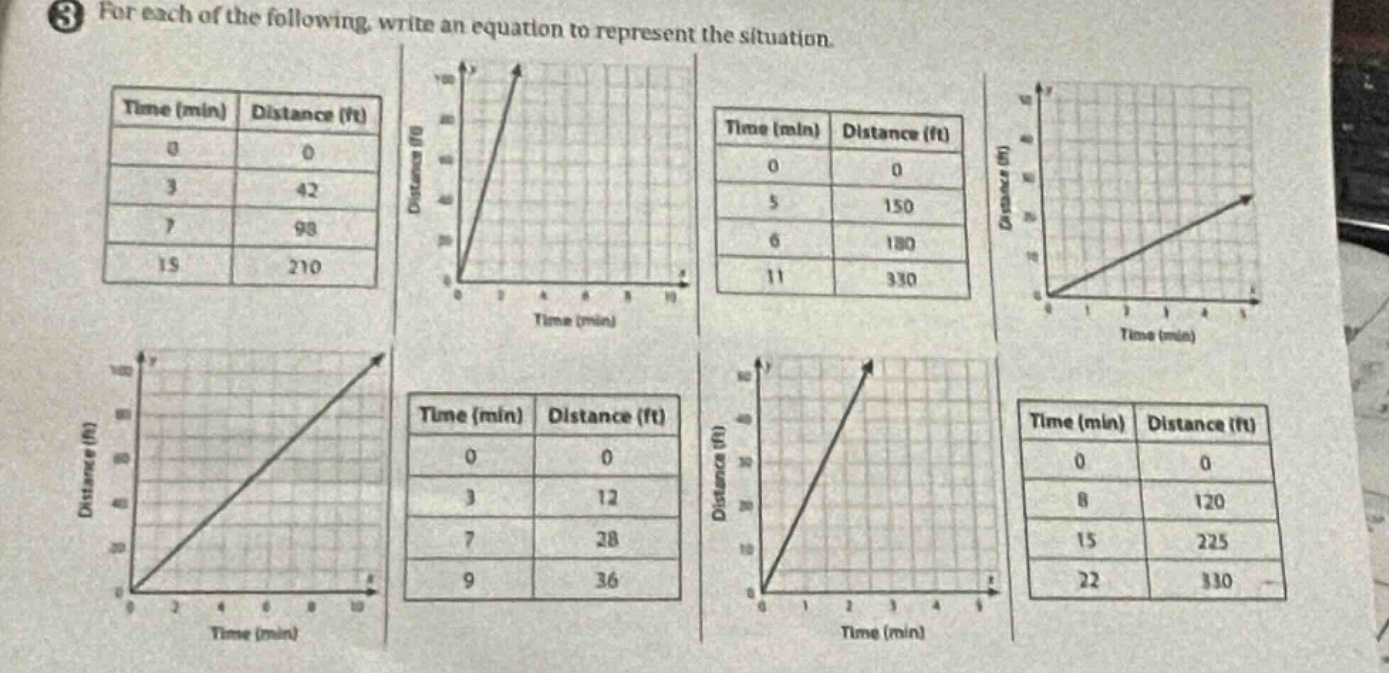
3 for each of the following, write an equation to represent the situation. tables and graphs about time (min) and distance (ft) are shown, including multiple tables with time and distance data and corresponding graphs plotting distance vs. time.
To solve this, we'll analyze each situation (table or graph) to find the relationship between time (\(t\)) and distance (\(d\)), assuming a linear relationship (\(d = mt + b\), and since at \(t = 0\), \(d = 0\), \(b = 0\), so \(d = mt\) where \(m\) is the speed or rate).
1. First Table (Time vs Distance: 0,3,7,15 mins; 0,42,98,210 ft)
- Calculate rate \(m\): \(\frac{42}{3} = 14\), \(\frac{98}{7} = 14\), \(\frac{210}{15} = 14\).
- Equation: \(d = 14t\)
2. First Graph (Time vs Distance, passes through origin)
- From the graph, when \(t = 3\), \(d = 90\) (estimating from grid). Rate \(m = \frac{90}{3} = 30\).
- Equation: \(d = 30t\)
3. Second Table (Time: 0,5,6,11 mins; Distance: 0,150,180,330 ft)
- Rate \(m\): \(\frac{150}{5} = 30\), \(\frac{180}{6} = 30\), \(\frac{330}{11} = 30\).
- Equation: \(d = 30t\)
4. Second Graph (Time vs Distance, passes through origin)
- When \(t = 5\), \(d = 25\) (estimating). Rate \(m = \frac{25}{5} = 5\).
- Equation: \(d = 5t\)
5. Third Graph (Time vs Distance, passes through origin)
- When \(t = 10\), \(d = 80\) (estimating). Rate \(m = \frac{80}{10} = 8\).
- Equation: \(d = 8t\)
6. Third Table (Time: 0,3,7,9 mins; Distance: 0,12,28,36 ft)
- Rate \(m\): \(\frac{12}{3} = 4\), \(\frac{28}{7} = 4\), \(\frac{36}{9} = 4\).
- Equation: \(d = 4t\)
7. Fourth Graph (Time vs Distance, passes through origin)
- When \(t = 3\), \(d = 45\) (estimating). Rate \(m = \frac{45}{3} = 15\).
- Equation: \(d = 15t\)
8. Fourth Table (Time: 0,8,15,22 mins; Distance: 0,120,225,330 ft)
- Rate \(m\): \(\frac{120}{8} = 15\), \(\frac{225}{15} = 15\), \(\frac{330}{22} = 15\).
- Equation: \(d = 15t\)
Final Answers (Examples for Each Situation):
- \(d = 14t\)
- \(d = 30t\)
- \(d = 30t\)
- \(d = 5t\)
- \(d = 8t\)
- \(d = 4t\)
- \(d = 15t\)
- \(d = 15t\)
(Note: For graphs, exact equations depend on precise grid interpretation, but the method is linear regression through the origin.)

Snap & solve any problem in the app
Get step-by-step solutions on Sovi AI
Photo-based solutions with guided steps
Explore more problems and detailed explanations
To solve this, we'll analyze each situation (table or graph) to find the relationship between time (\(t\)) and distance (\(d\)), assuming a linear relationship (\(d = mt + b\), and since at \(t = 0\), \(d = 0\), \(b = 0\), so \(d = mt\) where \(m\) is the speed or rate).
1. First Table (Time vs Distance: 0,3,7,15 mins; 0,42,98,210 ft)
- Calculate rate \(m\): \(\frac{42}{3} = 14\), \(\frac{98}{7} = 14\), \(\frac{210}{15} = 14\).
- Equation: \(d = 14t\)
2. First Graph (Time vs Distance, passes through origin)
- From the graph, when \(t = 3\), \(d = 90\) (estimating from grid). Rate \(m = \frac{90}{3} = 30\).
- Equation: \(d = 30t\)
3. Second Table (Time: 0,5,6,11 mins; Distance: 0,150,180,330 ft)
- Rate \(m\): \(\frac{150}{5} = 30\), \(\frac{180}{6} = 30\), \(\frac{330}{11} = 30\).
- Equation: \(d = 30t\)
4. Second Graph (Time vs Distance, passes through origin)
- When \(t = 5\), \(d = 25\) (estimating). Rate \(m = \frac{25}{5} = 5\).
- Equation: \(d = 5t\)
5. Third Graph (Time vs Distance, passes through origin)
- When \(t = 10\), \(d = 80\) (estimating). Rate \(m = \frac{80}{10} = 8\).
- Equation: \(d = 8t\)
6. Third Table (Time: 0,3,7,9 mins; Distance: 0,12,28,36 ft)
- Rate \(m\): \(\frac{12}{3} = 4\), \(\frac{28}{7} = 4\), \(\frac{36}{9} = 4\).
- Equation: \(d = 4t\)
7. Fourth Graph (Time vs Distance, passes through origin)
- When \(t = 3\), \(d = 45\) (estimating). Rate \(m = \frac{45}{3} = 15\).
- Equation: \(d = 15t\)
8. Fourth Table (Time: 0,8,15,22 mins; Distance: 0,120,225,330 ft)
- Rate \(m\): \(\frac{120}{8} = 15\), \(\frac{225}{15} = 15\), \(\frac{330}{22} = 15\).
- Equation: \(d = 15t\)
Final Answers (Examples for Each Situation):
- \(d = 14t\)
- \(d = 30t\)
- \(d = 30t\)
- \(d = 5t\)
- \(d = 8t\)
- \(d = 4t\)
- \(d = 15t\)
- \(d = 15t\)
(Note: For graphs, exact equations depend on precise grid interpretation, but the method is linear regression through the origin.)