QUESTION IMAGE
Question
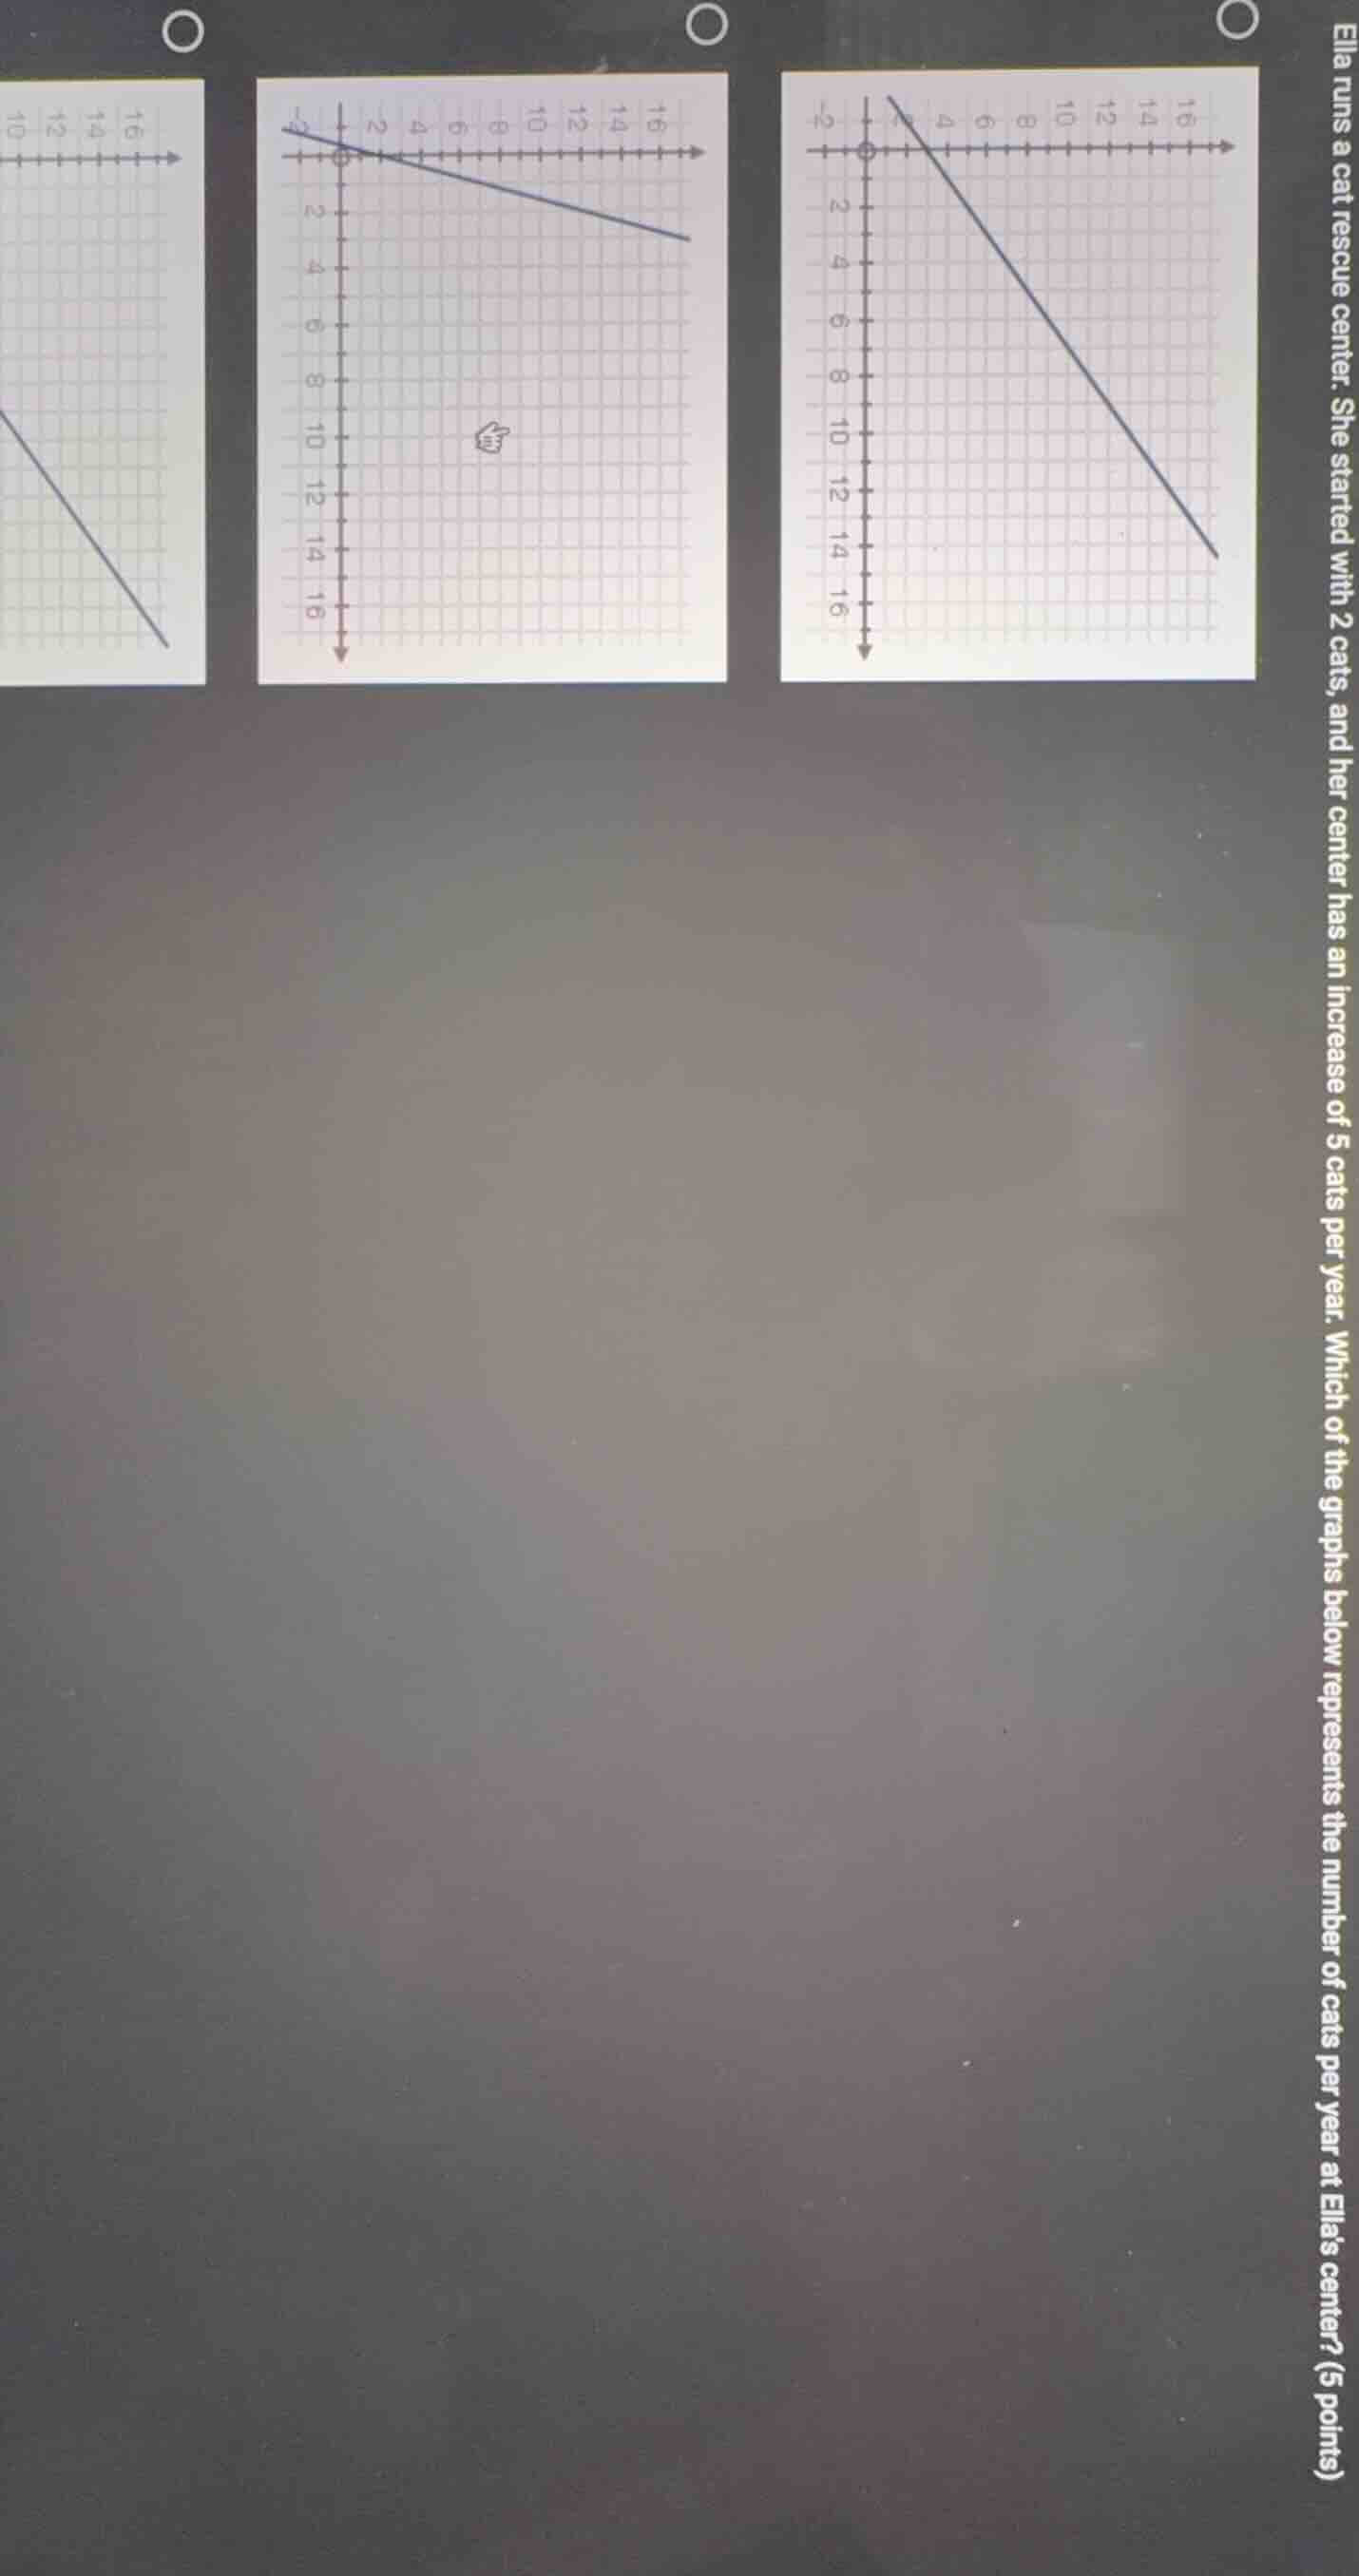
ella runs a cat rescue center. she started with 2 cats, and her center has an increase of 5 cats per year. which of the graphs below represents the number of cats per year at ellas center? (5 points)
Step1: Define linear relationship
Let $x$ = years, $y$ = number of cats. The equation is $y = 5x + 2$, where slope $m=5$ (rate of increase) and y-intercept $b=2$ (starting number of cats).
Step2: Analyze graph requirements
The line must cross the y-axis at $(0, 2)$ (closed dot, since year 0 has 2 cats) and have a positive steep slope (5 cats per year means steep upward trend).
Step3: Match to given graphs
The rightmost graph has a y-intercept at $(0, 2)$ and a steep positive slope, matching the equation. The middle graph has a shallow slope, and the left graph does not show the correct intercept/slope.

Snap & solve any problem in the app
Get step-by-step solutions on Sovi AI
Photo-based solutions with guided steps
Explore more problems and detailed explanations
The rightmost graph (with a steep upward line starting at the y-intercept (0, 2)) represents the number of cats per year at Ella's center.