QUESTION IMAGE
Question
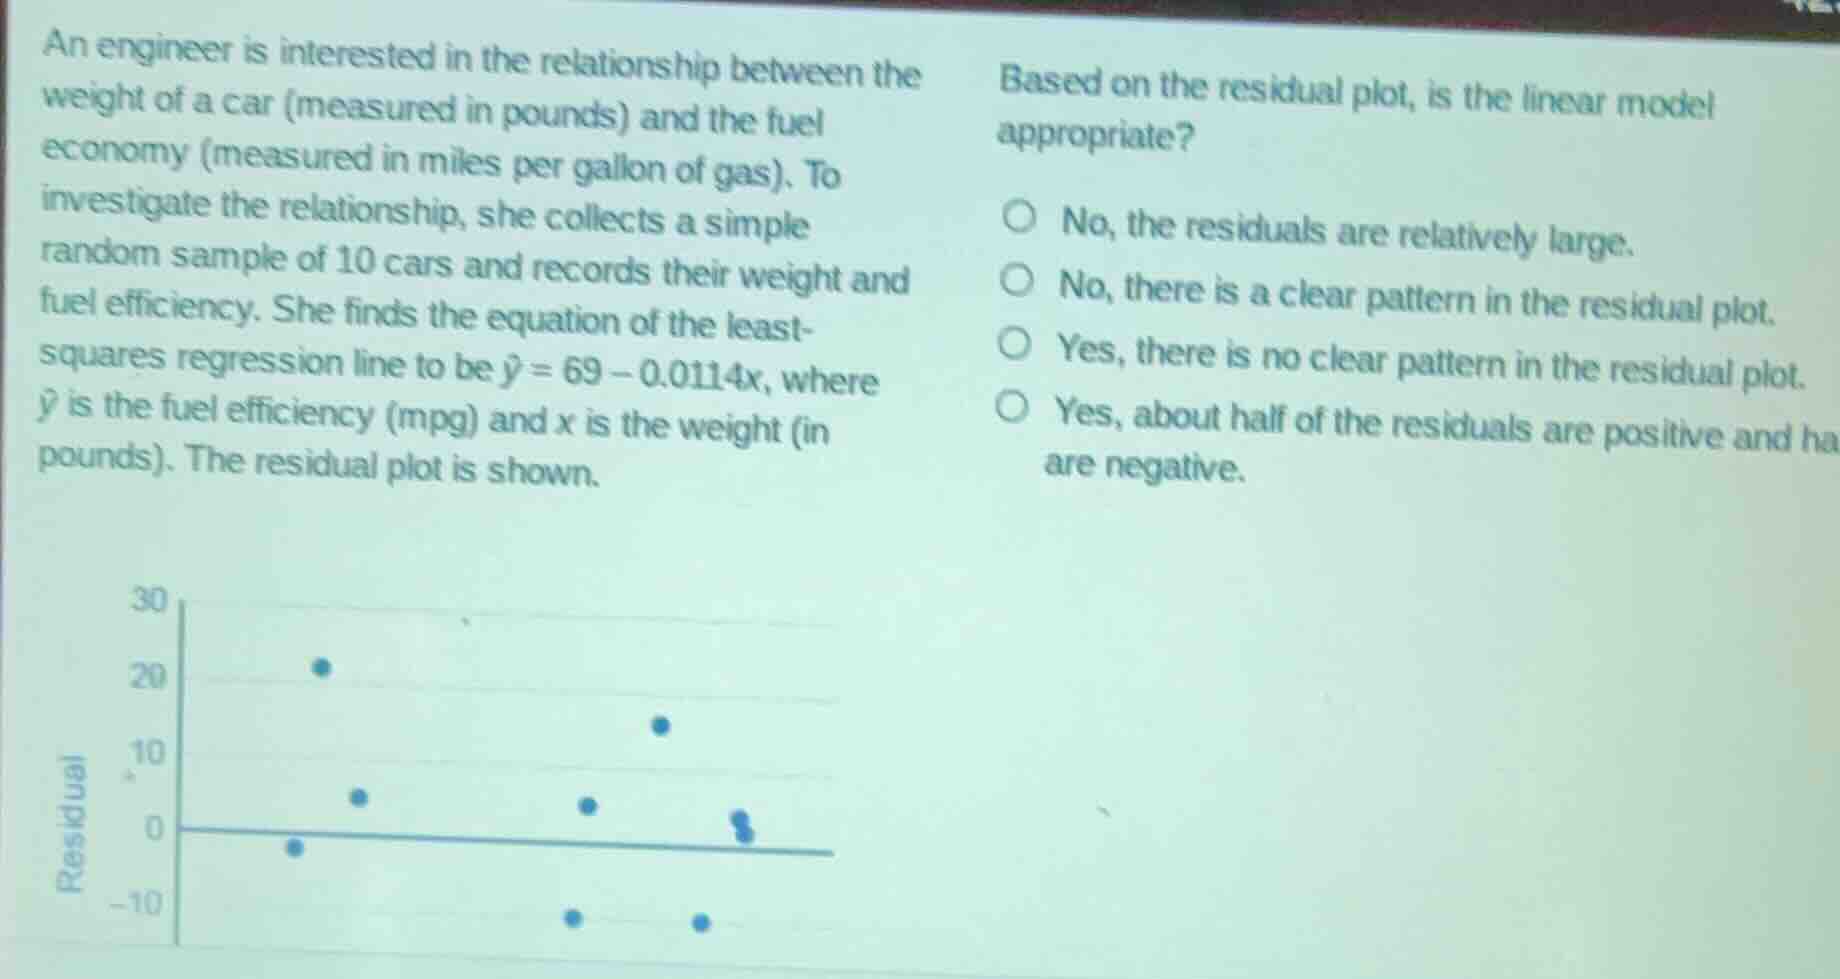
an engineer is interested in the relationship between the weight of a car (measured in pounds) and the fuel economy (measured in miles per gallon of gas). to investigate the relationship, she collects a simple random sample of 10 cars and records their weight and fuel efficiency. she finds the equation of the least-squares regression line to be \\(\hat{y} = 69 - 0.0114x\\), where \\(\hat{y}\\) is the fuel efficiency (mpg) and \\(x\\) is the weight (in pounds). the residual plot is shown. based on the residual plot, is the linear model appropriate? \\(\bigcirc\\) no, the residuals are relatively large. \\(\bigcirc\\) no, there is a clear pattern in the residual plot. \\(\bigcirc\\) yes, there is no clear pattern in the residual plot. \\(\bigcirc\\) yes, about half of the residuals are positive and ha are negative.
For a linear model to be appropriate, residuals should be randomly scattered with no clear pattern. The given residual plot shows a curved (U-shaped) pattern, which indicates the linear model is not a good fit for the data.

Snap & solve any problem in the app
Get step-by-step solutions on Sovi AI
Photo-based solutions with guided steps
Explore more problems and detailed explanations
No, there is a clear pattern in the residual plot.