QUESTION IMAGE
Question
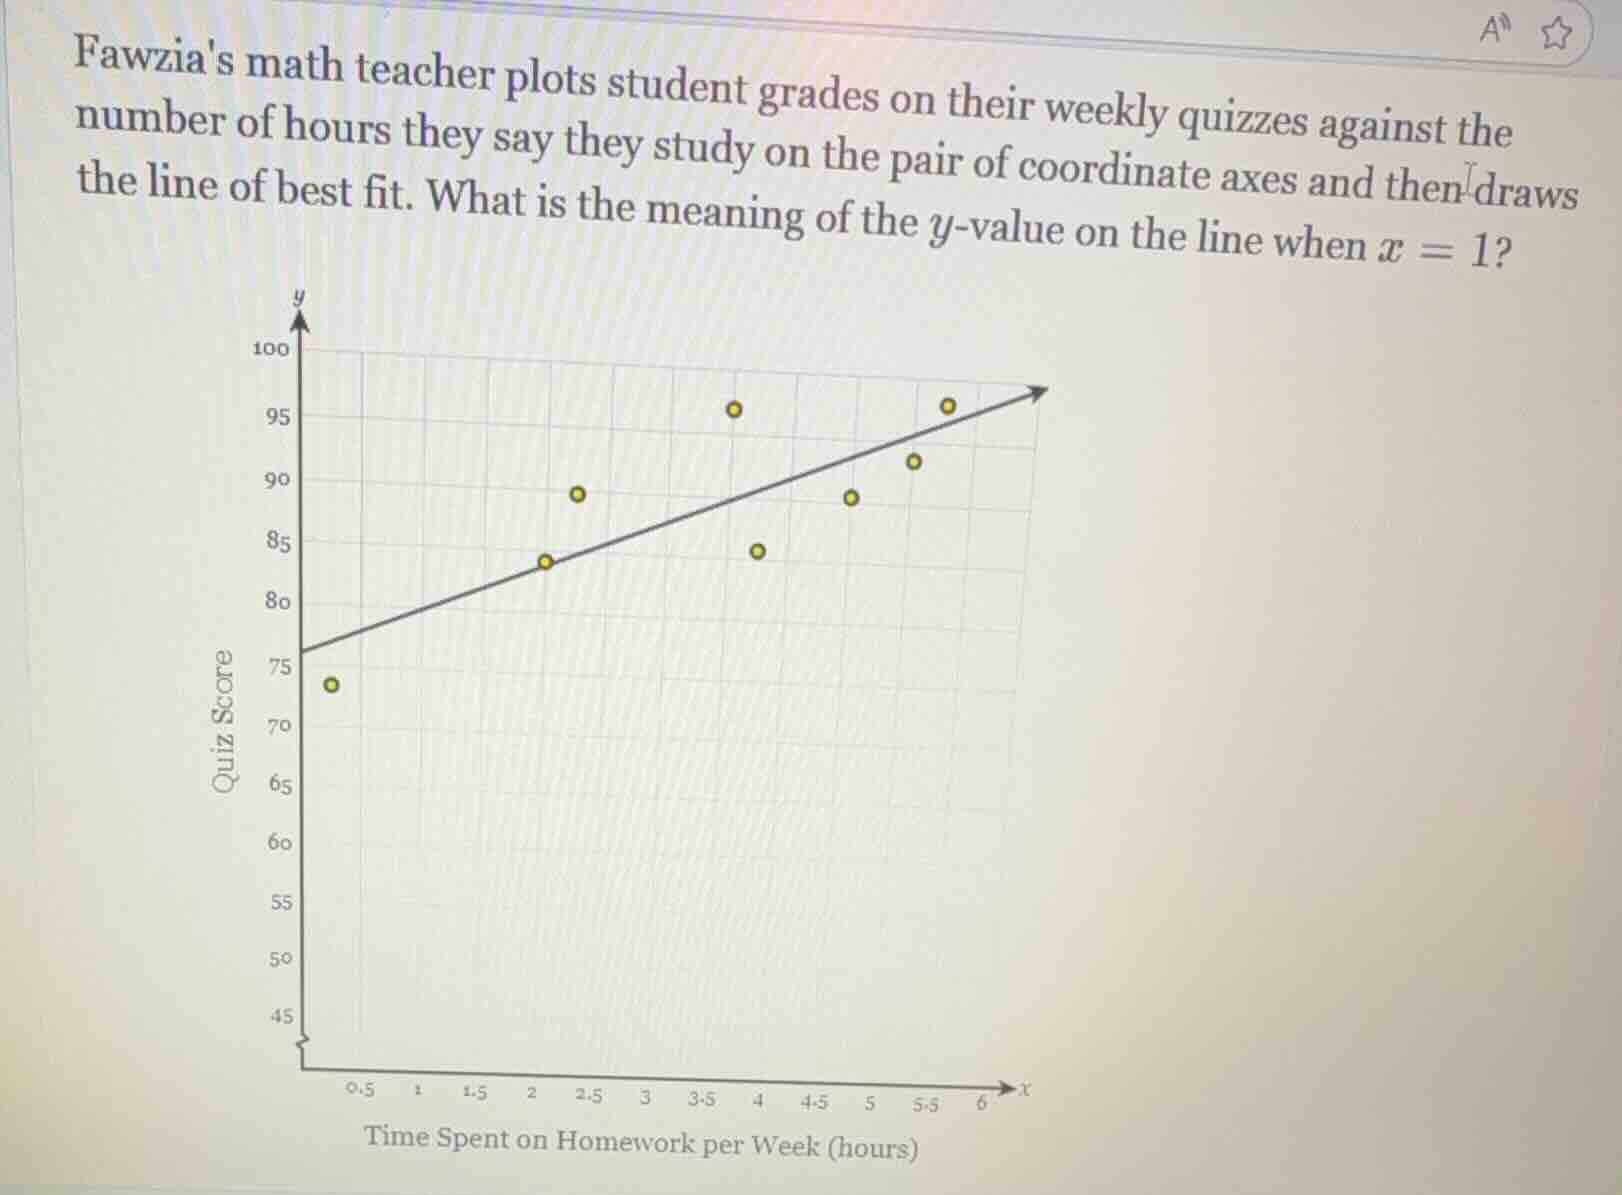
fawzias math teacher plots student grades on their weekly quizzes against the number of hours they say they study on the pair of coordinate axes and then draws the line of best fit. what is the meaning of the $y$-value on the line when $x = 1$?
The line of best fit is a predictive model for the relationship between study hours (x-axis) and quiz scores (y-axis). When $x=1$, the corresponding y-value on this line represents the predicted average quiz score for students who report spending 1 hour per week on homework.

Snap & solve any problem in the app
Get step-by-step solutions on Sovi AI
Photo-based solutions with guided steps
Explore more problems and detailed explanations
It is the predicted average quiz score for a student who spends 1 hour per week on homework.