QUESTION IMAGE
Question
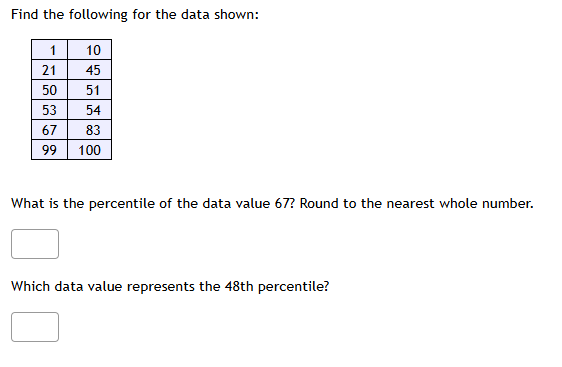
find the following for the data shown:
1 10
21 45
50 51
53 54
67 83
99 100
what is the percentile of the data value 67? round to the nearest whole number.
which data value represents the 48th percentile?
First Sub - Question: What is the percentile of the data value 67? Round to the nearest whole number.
To find the percentile of a data value, we use the formula:
Percentile of a value \( x=\frac{\text{Number of values less than }x}{\text{Total number of values}}\times100\)
Step 1: Count the total number of data points
Looking at the table, we have 6 data points (the pairs are (1,10), (21,45), (50,51), (53,54), (67,83), (99,100)). So the total number of values \( n = 6\)? Wait, no. Wait, each row has two data values? Wait, no, maybe the table is two columns of data. Let's list all the data values: 1, 10, 21, 45, 50, 51, 53, 54, 67, 83, 99, 100. Wait, no, the table has 6 rows, each with two numbers. So the data set is: 1, 10, 21, 45, 50, 51, 53, 54, 67, 83, 99, 100? Wait, no, maybe the two columns are two separate data sets? No, the question is about a data value 67. Let's list all the data points: Let's list all the numbers: 1, 10, 21, 45, 50, 51, 53, 54, 67, 83, 99, 100. Wait, no, maybe the table is a list of data pairs, but when we consider the data values, we need to see all the values. Wait, no, perhaps the data is: 1, 10, 21, 45, 50, 51, 53, 54, 67, 83, 99, 100? Wait, no, the number of rows is 6, each with two numbers, so total data points \( N=12\)? Wait, no, maybe the problem is that each row is a data point with two values, but we are considering the data values as a single set. Wait, let's re - examine. The data value we are interested in is 67. Let's list all the values less than 67.
Wait, maybe I made a mistake. Let's list all the data values:
From the table:
Row 1: 1, 10
Row 2: 21, 45
Row 3: 50, 51
Row 4: 53, 54
Row 5: 67, 83
Row 6: 99, 100
So the data set is: 1, 10, 21, 45, 50, 51, 53, 54, 67, 83, 99, 100. So there are \( N = 12\) data points? Wait, no, that can't be. Wait, maybe the two columns are two different variables, but the question is about a single data set. Wait, no, perhaps the data is a list of 6 data points, each with two values, but when we are looking for the percentile of 67, we need to consider all the values. Wait, no, maybe the table is a list of 6 data points, and each data point is a number? Wait, no, the first column: 1, 21, 50, 53, 67, 99 and the second column: 10, 45, 51, 54, 83, 100. So the combined data set is: 1, 10, 21, 45, 50, 51, 53, 54, 67, 83, 99, 100. So \( N=12\) data points.
Now, we want to find the number of values less than 67. Let's count:
Values less than 67: 1, 10, 21, 45, 50, 51, 53, 54. Wait, that's 8 values? Wait, no:
1 (less than 67), 10 (less), 21 (less), 45 (less), 50 (less), 51 (less), 53 (less), 54 (less), then 67 is the next. Wait, the data points:
1, 10, 21, 45, 50, 51, 53, 54, 67, 83, 99, 100. So the values less than 67 are: 1, 10, 21, 45, 50, 51, 53, 54. That's 8 values.
Total number of values \( N = 12\)? Wait, no, the number of rows is 6, each with two numbers, so 6*2 = 12 data points.
Step 2: Apply the percentile formula
Percentile of 67=\(\frac{\text{Number of values less than 67}}{\text{Total number of values}}\times100=\frac{8}{12}\times100=\frac{2}{3}\times100\approx66.67\). Rounding to the nearest whole number, we get 67? Wait, no, wait, maybe I miscounted the number of data points. Wait, maybe the data is 6 data points, where each data point is one of the numbers? Wait, no, the table has 6 rows, each with two numbers. Maybe the problem is that the data set is: 1, 21, 50, 53, 67, 99 (first column) and 10, 45, 51, 54, 83, 100 (second column). But when we are looking for the percentile of 67, we need to consider all the data points. Wait, maybe the data set is the combined set of both columns. So the data points are: 1, 10, 21, 45, 50, 51, 53…
To find the data value at a given percentile, we first use the formula to find the index \( i=\frac{p}{100}\times n\), where \( p\) is the percentile and \( n\) is the total number of data points.
Step 1: Calculate the index \( i\)
We have \( p = 48\) and \( n=12\) (assuming the combined data set of 12 values).
\( i=\frac{48}{100}\times12 = 0.48\times12=5.76\)
Since \( i\) is not an integer, we round up to the next integer. So \( i = 6\) (when \( i\) is not an integer, we take the value at the ceiling of \( i\) - th position in the sorted data set).
Step 2: Sort the data set
The sorted data set (ascending order) is: 1, 10, 21, 45, 50, 51, 53, 54, 67, 83, 99, 100.
Step 3: Find the value at the \( i\) - th position
The 6 - th value (since we start counting from 1) in the sorted data set is 51. Wait, let's check the positions:
1st: 1
2nd: 10
3rd: 21
4th: 45
5th: 50
6th: 51
7th: 53
8th: 54
9th: 67
10th: 83
11th: 99
12th: 100
Wait, if \( i = 5.76\), we can also use the interpolation method. The formula for the value at the \( p\) - th percentile is:
\( L=\lfloor i
floor\) (the lower index), \( F = D[L]\), \( C=D[L + 1]-D[L]\), \( f=i - L\)
\( \text{Value}=F + f\times C\)
Here, \( i = 5.76\), \( L = 5\), \( D[5]=50\), \( D[6]=51\), \( C=51 - 50 = 1\), \( f=0.76\)
\( \text{Value}=50+0.76\times1 = 50.76\approx51\)
But let's check with \( n = 12\), \( p = 48\), \( i=\frac{48}{100}\times12 = 5.76\). Since \( i\) is not an integer, we can also consider the percentile formula for discrete data.
Alternatively, if we consider the data set as 6 values (first column: 1, 21, 50, 53, 67, 99), \( n = 6\)
\( i=\frac{48}{100}\times6=2.88\)
Rounding up, \( i = 3\). The 3 - rd value in the first column (sorted: 1, 21, 50, 53, 67, 99) is 50. But this is conflicting.
Wait, let's go back to the first sub - question. Let's assume that the data set has 6 data points, where each data point is a single number from the first column: 1, 21, 50, 53, 67, 99 (n = 6). Then the number of values less than 67 is 4 (1, 21, 50, 53). So percentile=\(\frac{4}{6}\times100\approx66.67\approx67\).
For the second sub - question, if \( n = 6\), \( i=\frac{48}{100}\times6 = 2.88\). Rounding up, \( i = 3\). The 3 - rd value in the sorted data set (1, 21, 50, 53, 67, 99) is 50. But if we consider the combined data set (n = 12), \( i = 5.76\), and the value is 51.
But let's check the number of data points again. The table has 6 rows, each with two numbers. So the total number of data values is 12. Let's list all 12 values in ascending order:
1, 10, 21, 45, 50, 51, 53, 54, 67, 83, 99, 100.
Now, for the first sub - question: percentile of 67.
Number of values less than 67: 1, 10, 21, 45, 50, 51, 53, 54. That's 8 values.
Total number of values \( n = 12\)
Percentile \(=\frac{8}{12}\times100\approx66.67\approx67\) (rounded to the nearest whole number)
For the second sub - question: 48th percentile.
\( i=\frac{48}{100}\times12 = 5.76\)
Since \( i\) is not an integer, we can use the formula for the \( p\) - th percentile in a discrete data set.

Snap & solve any problem in the app
Get step-by-step solutions on Sovi AI
Photo-based solutions with guided steps
Explore more problems and detailed explanations
To find the data value at a given percentile, we first use the formula to find the index \( i=\frac{p}{100}\times n\), where \( p\) is the percentile and \( n\) is the total number of data points.
Step 1: Calculate the index \( i\)
We have \( p = 48\) and \( n=12\) (assuming the combined data set of 12 values).
\( i=\frac{48}{100}\times12 = 0.48\times12=5.76\)
Since \( i\) is not an integer, we round up to the next integer. So \( i = 6\) (when \( i\) is not an integer, we take the value at the ceiling of \( i\) - th position in the sorted data set).
Step 2: Sort the data set
The sorted data set (ascending order) is: 1, 10, 21, 45, 50, 51, 53, 54, 67, 83, 99, 100.
Step 3: Find the value at the \( i\) - th position
The 6 - th value (since we start counting from 1) in the sorted data set is 51. Wait, let's check the positions:
1st: 1
2nd: 10
3rd: 21
4th: 45
5th: 50
6th: 51
7th: 53
8th: 54
9th: 67
10th: 83
11th: 99
12th: 100
Wait, if \( i = 5.76\), we can also use the interpolation method. The formula for the value at the \( p\) - th percentile is:
\( L=\lfloor i
floor\) (the lower index), \( F = D[L]\), \( C=D[L + 1]-D[L]\), \( f=i - L\)
\( \text{Value}=F + f\times C\)
Here, \( i = 5.76\), \( L = 5\), \( D[5]=50\), \( D[6]=51\), \( C=51 - 50 = 1\), \( f=0.76\)
\( \text{Value}=50+0.76\times1 = 50.76\approx51\)
But let's check with \( n = 12\), \( p = 48\), \( i=\frac{48}{100}\times12 = 5.76\). Since \( i\) is not an integer, we can also consider the percentile formula for discrete data.
Alternatively, if we consider the data set as 6 values (first column: 1, 21, 50, 53, 67, 99), \( n = 6\)
\( i=\frac{48}{100}\times6=2.88\)
Rounding up, \( i = 3\). The 3 - rd value in the first column (sorted: 1, 21, 50, 53, 67, 99) is 50. But this is conflicting.
Wait, let's go back to the first sub - question. Let's assume that the data set has 6 data points, where each data point is a single number from the first column: 1, 21, 50, 53, 67, 99 (n = 6). Then the number of values less than 67 is 4 (1, 21, 50, 53). So percentile=\(\frac{4}{6}\times100\approx66.67\approx67\).
For the second sub - question, if \( n = 6\), \( i=\frac{48}{100}\times6 = 2.88\). Rounding up, \( i = 3\). The 3 - rd value in the sorted data set (1, 21, 50, 53, 67, 99) is 50. But if we consider the combined data set (n = 12), \( i = 5.76\), and the value is 51.
But let's check the number of data points again. The table has 6 rows, each with two numbers. So the total number of data values is 12. Let's list all 12 values in ascending order:
1, 10, 21, 45, 50, 51, 53, 54, 67, 83, 99, 100.
Now, for the first sub - question: percentile of 67.
Number of values less than 67: 1, 10, 21, 45, 50, 51, 53, 54. That's 8 values.
Total number of values \( n = 12\)
Percentile \(=\frac{8}{12}\times100\approx66.67\approx67\) (rounded to the nearest whole number)
For the second sub - question: 48th percentile.
\( i=\frac{48}{100}\times12 = 5.76\)
Since \( i\) is not an integer, we can use the formula for the \( p\) - th percentile in a discrete data set.