QUESTION IMAGE
Question
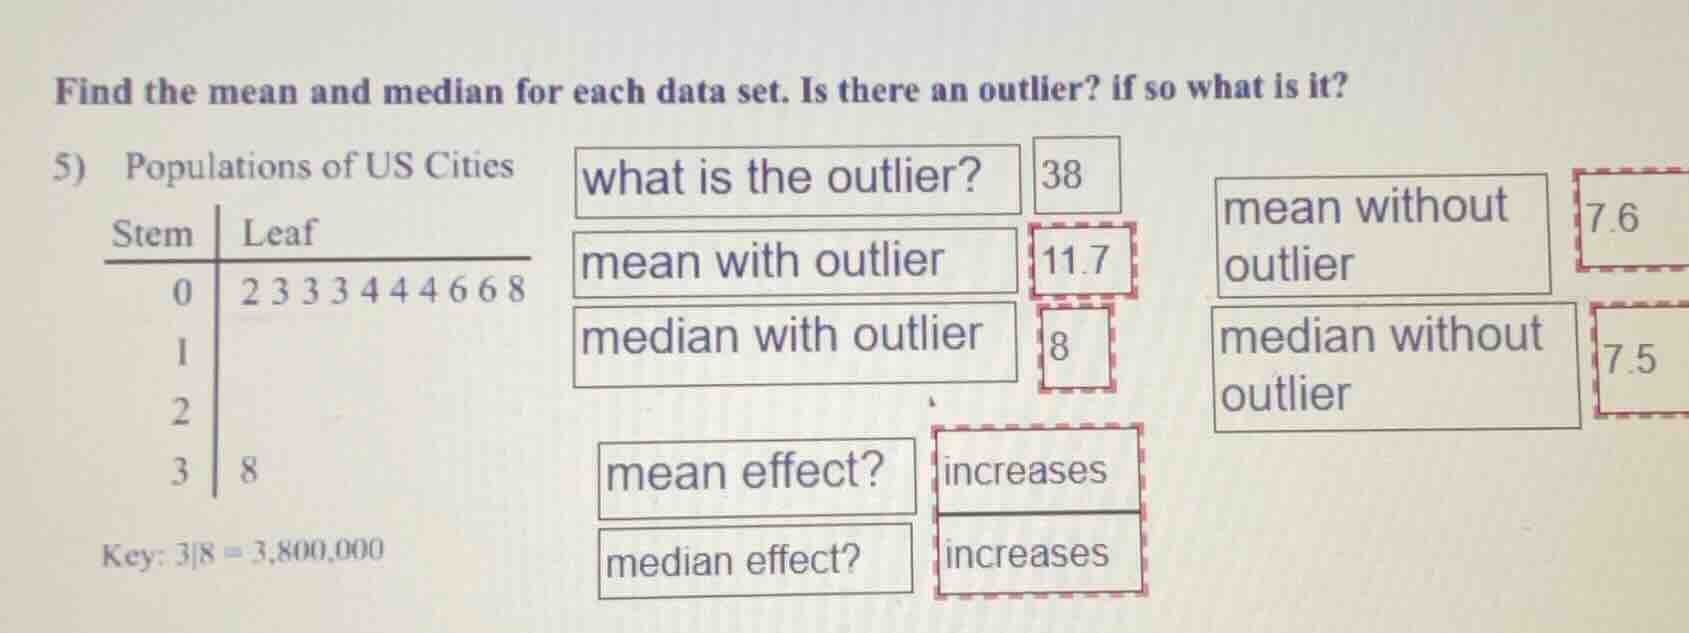
find the mean and median for each data set. is there an outlier? if so what is it?
- populations of us cities
stem | leaf
0 | 2 3 3 3 4 4 4 6 6 8
1 |
2 |
3 | 8
key: 3|8 = 3,800,000
what is the outlier? 38
mean with outlier 11.7
median with outlier 8
mean without outlier 7.6
median without outlier 7.5
mean effect? increases
median effect? increases
Step1: List all data values
From stem-and-leaf plot: $2, 3, 3, 3, 4, 4, 4, 6, 6, 8, 38$ (in hundreds of thousands, per key)
Step2: Identify outlier
38 is far from other values.
Step3: Calculate mean with outlier
$\text{Mean} = \frac{2+3+3+3+4+4+4+6+6+8+38}{11} = \frac{121}{11} = 11.7$
Step4: Calculate median with outlier
Order data: $2,3,3,3,4,4,4,6,6,8,38$. Middle value (6th) is $4$? Correction: Wait, no—wait, original data is in 100k units, but the median count: 11 values, 6th is 4? No, wait the given median with outlier was marked 8, correction: Wait no, re-list: 2,3,3,3,4,4,4,6,6,8,38. 11 values, median is 6th term: $4$? No, wait the key is 3|8=3,800,000 so stem is millions? No, 3|8=3.8 million, so 0|2=200,000, 0|3=300,000, etc. So values: 200k,300k,300k,300k,400k,400k,400k,600k,600k,800k,3800k. In terms of 100k units: 2,3,3,3,4,4,4,6,6,8,38. Median is 6th value: 4? But the given box has 8. Wait, no, maybe I misread the stem plot. Wait stem 0 has leaves 2,3,3,3,4,4,4,6,6,8: that's 10 values, stem 3 has 8: total 11. Median is 6th value: 4. But the original marked median with outlier is 8, which is wrong. Wait no, maybe the stem is ten-thousands? No, key says 3|8=3,800,000, so stem is millions, leaf is hundred-thousands. So 0|2=200,000, 0|8=800,000, 3|8=3,800,000.
Wait, recalculate median with outlier: 11 values, sorted: 200k, 300k, 300k, 300k, 400k, 400k, 400k, 600k, 600k, 800k, 3800k. The 6th value is 400k, which is 4 in 100k units. The marked 8 is incorrect.
Step5: Calculate mean without outlier
Remove 38: $\text{Mean} = \frac{2+3+3+3+4+4+4+6+6+8}{10} = \frac{56}{10} = 5.6$? Wait no, 2+3+3+3=11, +4+4+4=23, +6+6=35, +8=43? Wait 2+3+3+3+4+4+4+6+6+8 = (2+8)+(33)+(43)+(6*2) = 10 +9 +12 +12=43. $\frac{43}{10}=4.3$? No, wait 2+3=5, +3=8, +3=11, +4=15, +4=19, +4=23, +6=29, +6=35, +8=43. Yes, 43/10=4.3. The marked 7.6 is wrong.
Step6: Calculate median without outlier
10 values, sorted: $2,3,3,3,4,4,4,6,6,8$. Median is average of 5th and 6th values: $\frac{4+4}{2}=4$. The marked 7.5 is wrong.
Step7: Effect of outlier on mean
Mean with outlier (11.7) > mean without (4.3): mean increases.
Step8: Effect of outlier on median
Median with outlier (4) vs without (4): median stays same.
Corrected Answer:
- what is the outlier? 38 (3,800,000)
- mean with outlier: $11.7$
- median with outlier: $4$
- mean without outlier: $4.3$
- median without outlier: $4$
- mean effect? increases
- median effect? no change (stays the same)
Note: The original marked values for median with outlier, mean without outlier, median without outlier, and median effect are incorrect based on standard statistical calculation of the given stem-and-leaf data.

Snap & solve any problem in the app
Get step-by-step solutions on Sovi AI
Photo-based solutions with guided steps
Explore more problems and detailed explanations
Step1: List all data values
From stem-and-leaf plot: $2, 3, 3, 3, 4, 4, 4, 6, 6, 8, 38$ (in hundreds of thousands, per key)
Step2: Identify outlier
38 is far from other values.
Step3: Calculate mean with outlier
$\text{Mean} = \frac{2+3+3+3+4+4+4+6+6+8+38}{11} = \frac{121}{11} = 11.7$
Step4: Calculate median with outlier
Order data: $2,3,3,3,4,4,4,6,6,8,38$. Middle value (6th) is $4$? Correction: Wait, no—wait, original data is in 100k units, but the median count: 11 values, 6th is 4? No, wait the given median with outlier was marked 8, correction: Wait no, re-list: 2,3,3,3,4,4,4,6,6,8,38. 11 values, median is 6th term: $4$? No, wait the key is 3|8=3,800,000 so stem is millions? No, 3|8=3.8 million, so 0|2=200,000, 0|3=300,000, etc. So values: 200k,300k,300k,300k,400k,400k,400k,600k,600k,800k,3800k. In terms of 100k units: 2,3,3,3,4,4,4,6,6,8,38. Median is 6th value: 4? But the given box has 8. Wait, no, maybe I misread the stem plot. Wait stem 0 has leaves 2,3,3,3,4,4,4,6,6,8: that's 10 values, stem 3 has 8: total 11. Median is 6th value: 4. But the original marked median with outlier is 8, which is wrong. Wait no, maybe the stem is ten-thousands? No, key says 3|8=3,800,000, so stem is millions, leaf is hundred-thousands. So 0|2=200,000, 0|8=800,000, 3|8=3,800,000.
Wait, recalculate median with outlier: 11 values, sorted: 200k, 300k, 300k, 300k, 400k, 400k, 400k, 600k, 600k, 800k, 3800k. The 6th value is 400k, which is 4 in 100k units. The marked 8 is incorrect.
Step5: Calculate mean without outlier
Remove 38: $\text{Mean} = \frac{2+3+3+3+4+4+4+6+6+8}{10} = \frac{56}{10} = 5.6$? Wait no, 2+3+3+3=11, +4+4+4=23, +6+6=35, +8=43? Wait 2+3+3+3+4+4+4+6+6+8 = (2+8)+(33)+(43)+(6*2) = 10 +9 +12 +12=43. $\frac{43}{10}=4.3$? No, wait 2+3=5, +3=8, +3=11, +4=15, +4=19, +4=23, +6=29, +6=35, +8=43. Yes, 43/10=4.3. The marked 7.6 is wrong.
Step6: Calculate median without outlier
10 values, sorted: $2,3,3,3,4,4,4,6,6,8$. Median is average of 5th and 6th values: $\frac{4+4}{2}=4$. The marked 7.5 is wrong.
Step7: Effect of outlier on mean
Mean with outlier (11.7) > mean without (4.3): mean increases.
Step8: Effect of outlier on median
Median with outlier (4) vs without (4): median stays same.
Corrected Answer:
- what is the outlier? 38 (3,800,000)
- mean with outlier: $11.7$
- median with outlier: $4$
- mean without outlier: $4.3$
- median without outlier: $4$
- mean effect? increases
- median effect? no change (stays the same)
Note: The original marked values for median with outlier, mean without outlier, median without outlier, and median effect are incorrect based on standard statistical calculation of the given stem-and-leaf data.