QUESTION IMAGE
Question
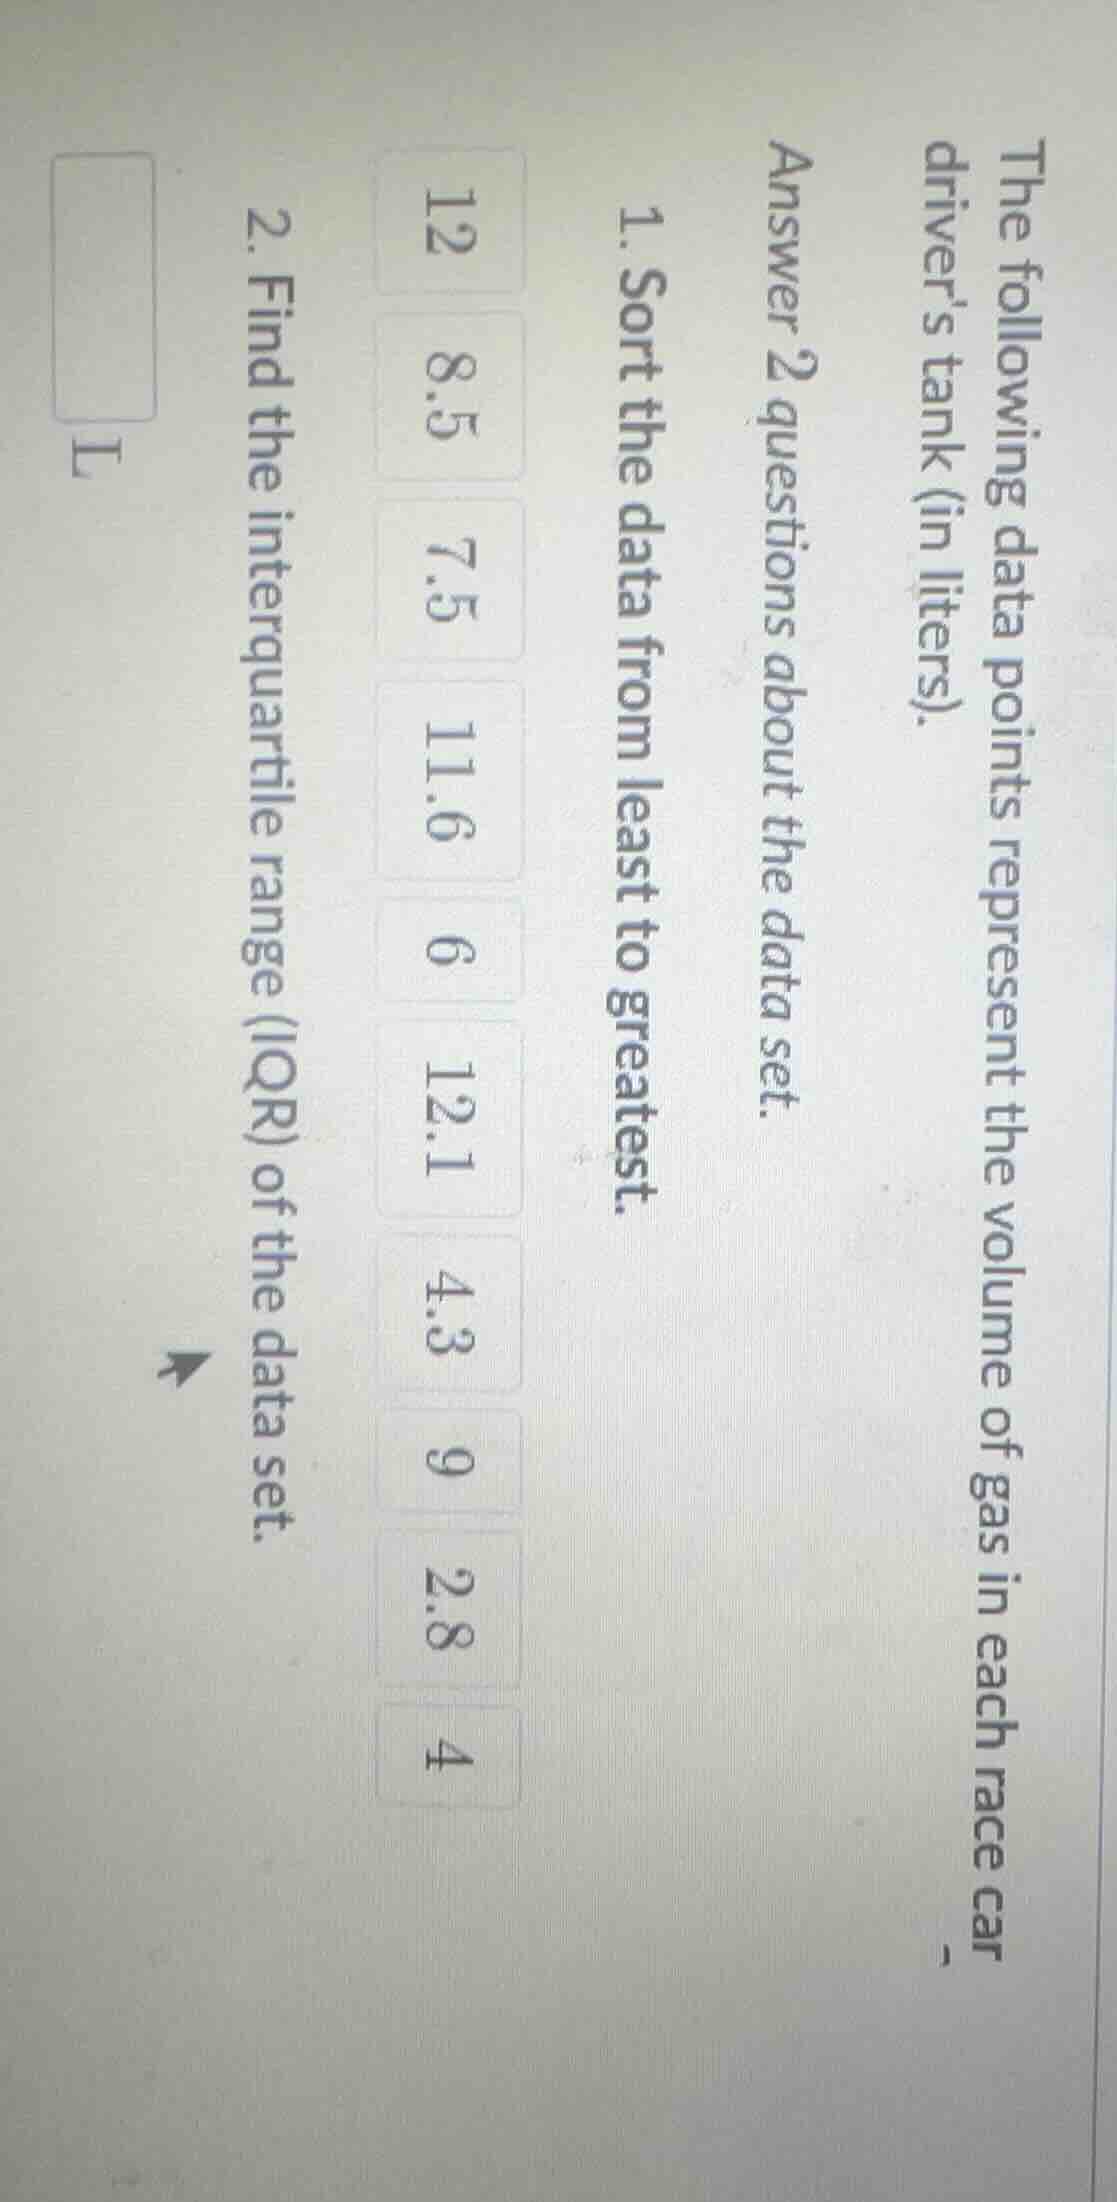
the following data points represent the volume of gas in each race car drivers tank (in liters).
answer 2 questions about the data set.
- sort the data from least to greatest.
12
8.5
7.5
11.6
6
12.1
4.3
9
2.8
4
- find the interquartile range (iqr) of the data set.
l
1. Sort the data from least to greatest
Step1: Identify all data points
The data points are: \(12, 8.5, 7.5, 11.6, 6, 12.1, 4.3, 9, 2.8, 4\)
Step2: Compare and sort
Start with the smallest number. Compare each number:
- \(2.8\) is the smallest. Then \(4\), \(4.3\), \(6\), \(7.5\), \(8.5\), \(9\), \(11.6\), \(12\), \(12.1\) (since \(12 < 12.1\))
So the sorted data is: \(2.8, 4, 4.3, 6, 7.5, 8.5, 9, 11.6, 12, 12.1\)
Step1: Find the median (Q2)
The data set has \(n = 10\) (even number of observations). The median is the average of the \(\frac{n}{2}\)-th and \((\frac{n}{2}+1)\)-th values.
\(\frac{n}{2}=5\), \(\frac{n}{2}+1 = 6\)
From the sorted data: \(2.8, 4, 4.3, 6, 7.5, 8.5, 9, 11.6, 12, 12.1\)
The 5th value is \(7.5\), the 6th value is \(8.5\)
Median \(Q2=\frac{7.5 + 8.5}{2}=\frac{16}{2}=8\)
Step2: Find Q1 (median of lower half)
Lower half: data before the median (first 5 values): \(2.8, 4, 4.3, 6, 7.5\)
\(n_{lower}=5\) (odd), median (Q1) is the \(\frac{5 + 1}{2}=3\)-rd value.
3rd value in lower half: \(4.3\)
Step3: Find Q3 (median of upper half)
Upper half: data after the median (last 5 values): \(8.5, 9, 11.6, 12, 12.1\)
\(n_{upper}=5\) (odd), median (Q3) is the \(\frac{5 + 1}{2}=3\)-rd value.
3rd value in upper half: \(11.6\)
Step4: Calculate IQR
IQR \(= Q3 - Q1\)
\(IQR=11.6 - 4.3 = 7.3\)

Snap & solve any problem in the app
Get step-by-step solutions on Sovi AI
Photo-based solutions with guided steps
Explore more problems and detailed explanations
\(2.8, 4, 4.3, 6, 7.5, 8.5, 9, 11.6, 12, 12.1\)