QUESTION IMAGE
Question
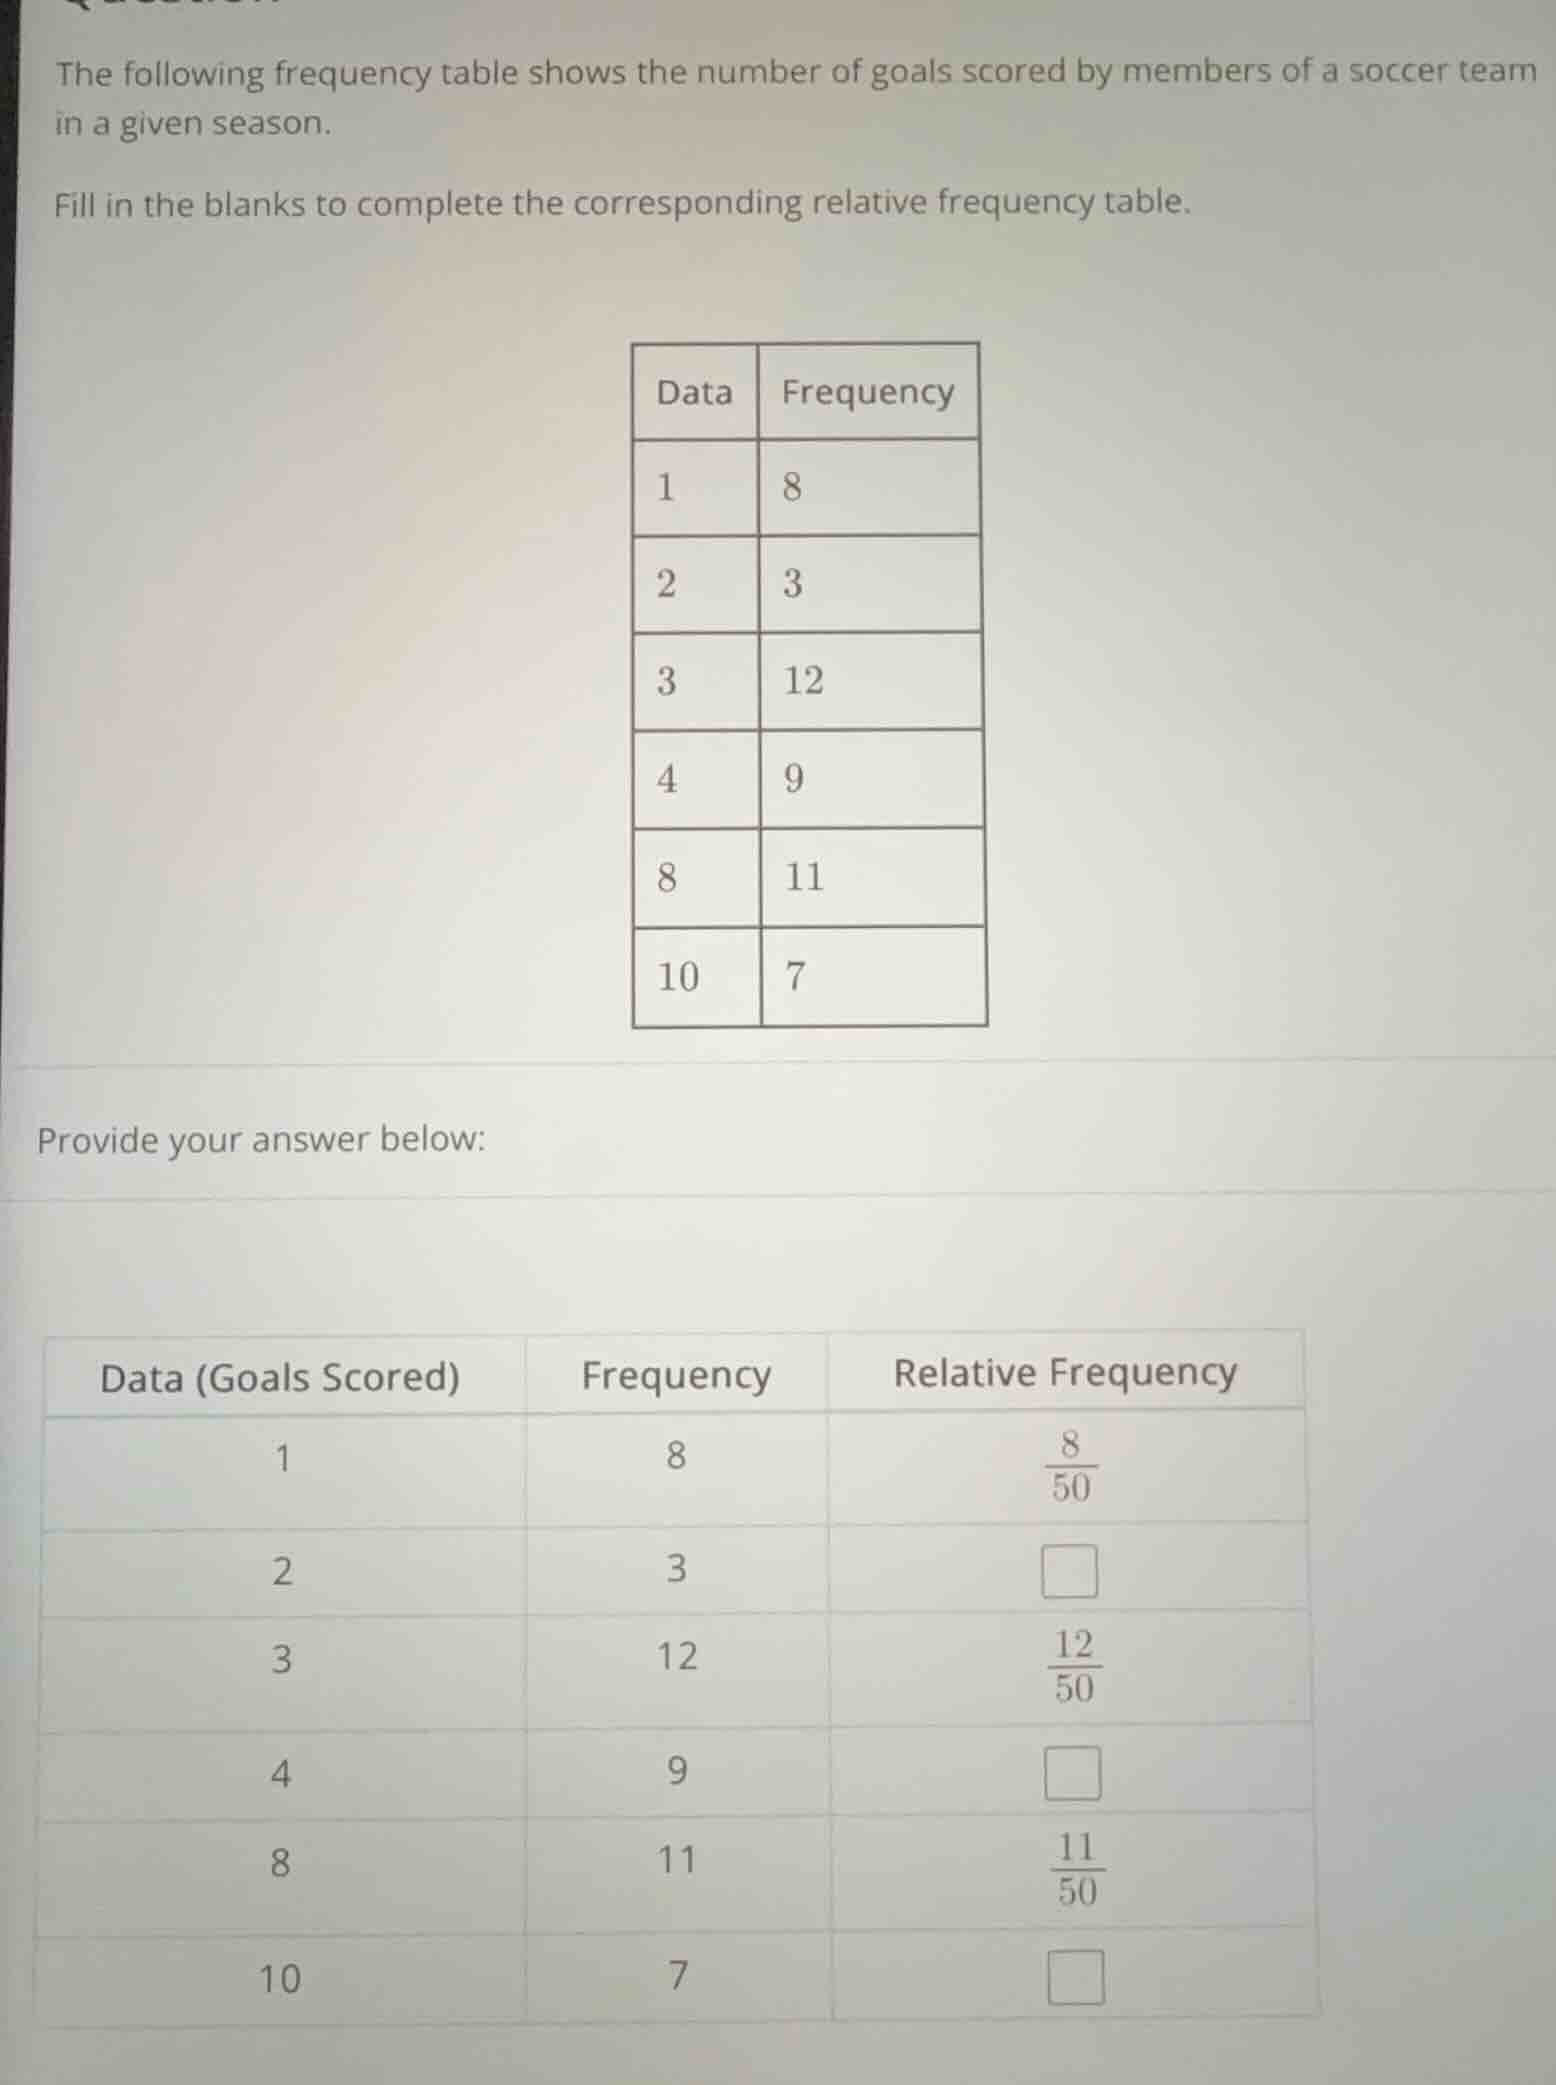
the following frequency table shows the number of goals scored by members of a soccer team in a given season. fill in the blanks to complete the corresponding relative frequency table. \
provide your answer below: \
Step1: Find total frequency
First, we calculate the total number of observations (total frequency). We sum up all the frequencies: \(8 + 3+12 + 9+11 + 7=50\). This is consistent with the first relative frequency denominator (\(50\)).
Step2: Calculate relative frequency for data value 2
Relative frequency is calculated as \(\frac{\text{Frequency}}{\text{Total Frequency}}\). For data value 2, frequency is 3, so relative frequency is \(\frac{3}{50}\).
Step3: Calculate relative frequency for data value 4
For data value 4, frequency is 9, so relative frequency is \(\frac{9}{50}\).
Step4: Calculate relative frequency for data value 10
For data value 10, frequency is 7, so relative frequency is \(\frac{7}{50}\).

Snap & solve any problem in the app
Get step-by-step solutions on Sovi AI
Photo-based solutions with guided steps
Explore more problems and detailed explanations
For data value 2: \(\frac{3}{50}\)
For data value 4: \(\frac{9}{50}\)
For data value 10: \(\frac{7}{50}\)
So the completed relative frequency table (for the blanks) has:
- For 2: \(\frac{3}{50}\)
- For 4: \(\frac{9}{50}\)
- For 10: \(\frac{7}{50}\)