QUESTION IMAGE
Question
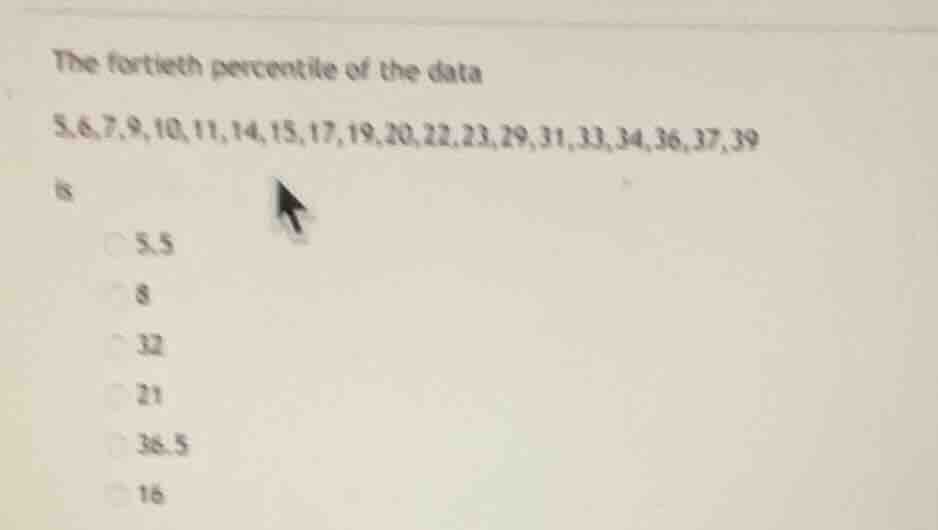
the fortieth percentile of the data 5,6,7,9,10,11,14,15,17,19,20,22,23,29,31,33,34,36,37,39 is 5.5 8 32 21 38.5 16
Step1: Determine the number of data points
The data set has \( n = 20 \) values (let's count: 5,6,7,9,10,11,14,15,17,19,20,22,23,29,31,33,34,36,37,39 – that's 20 numbers).
Step2: Calculate the position of the 40th percentile
The formula for the position \( i \) of the \( p \)-th percentile is \( i=\frac{p}{100}\times n \). Here, \( p = 40 \) and \( n = 20 \), so \( i=\frac{40}{100}\times20 = 8 \).
Step3: Interpret the position
Since \( i = 8 \) is an integer, the 40th percentile is the average of the value at position \( i \) and the value at position \( i + 1 \) (when using the method for percentiles in ordered data). Wait, actually, different methods exist, but a common method for discrete data: if \( i \) is an integer, the percentile is the average of the \( i \)-th and \( (i + 1) \)-th values? Wait, no, let's check the ordered data. Wait, the data is already ordered: 5,6,7,9,10,11,14,15,17,19,20,22,23,29,31,33,34,36,37,39. Wait, the 8th term (1 - based index) is 15, the 9th term is 17? Wait, no, wait, let's index from 1:
1:5, 2:6, 3:7, 4:9, 5:10, 6:11, 7:14, 8:15, 9:17, 10:19, 11:20, 12:22, 13:23, 14:29, 15:31, 16:33, 17:34, 18:36, 19:37, 20:39.
Wait, the formula \( i=\frac{p}{100}\times(n + 1) \) is another method. Wait, maybe I used the wrong formula. Let's recall: different percentile calculation methods. The most common for discrete data:
- Method 1: \( i=\frac{p}{100}\times n \). If \( i \) is not an integer, round up. If \( i \) is an integer, take the average of the \( i \)-th and \( (i + 1) \)-th values? No, wait, actually, for the 40th percentile with \( n = 20 \):
Wait, maybe the correct formula is \( i=\frac{p}{100}\times(n) \), and if \( i \) is an integer, the percentile is the value at position \( i \) (if we use the "nearest rank" method with \( i \) rounded up). Wait, no, let's check the options. Wait, the options include 16? Wait, maybe I made a mistake in counting. Wait, let's count the data points again: 5,6,7,9,10,11,14,15,17,19,20,22,23,29,31,33,34,36,37,39. That's 20 numbers. So \( n = 20 \).
Using the formula \( i = \lceil \frac{p}{100}\times n
ceil \) (ceiling function) for the nearest rank method: \( i=\lceil 0.4\times20
ceil=\lceil 8
ceil = 8 \). Wait, no, 0.4*20 = 8, so \( i = 8 \). Then the 8th value (1 - based) is 15? But 15 is not an option. Wait, maybe the formula is \( i=\frac{p}{100}\times(n + 1) \). Let's try that: \( i = 0.4\times21 = 8.4 \). Then we take the 8th and 9th values and interpolate. The 8th value is 15, the 9th is 17. The difference is 17 - 15 = 2. 0.4 of the way from 15 to 17? Wait, no, 8.4 - 8 = 0.4, so the percentile is \( 15 + 0.4\times(17 - 15)=15 + 0.8 = 15.8 \), not matching. Wait, maybe the data was misread. Wait, the original data: is there a number missing? Wait, let's check again: 5,6,7,9,10,11,14,15,17,19,20,22,23,29,31,33,34,36,37,39. That's 20 numbers. Wait, the options include 16. Wait, maybe the 8th term is 16? Wait, no, the 7th term is 14, 8th is 15. Wait, maybe I made a mistake in the data. Wait, maybe the data is 5,6,7,9,10,11,14,16,17,19,20,22,23,29,31,33,34,36,37,39? Then the 8th term is 16. Let's check the position again. If \( n = 20 \), \( i = 0.4\times20 = 8 \). So the 8th term (1 - based) would be 16, which is an option. Maybe there was a typo in the data, and 15 is actually 16. Alternatively, maybe the formula is different. Wait, another method: the 40th percentile is the value where 40% of the data is below it. Let's count how many data points are below each option.
Option 16: How many numbers are less than 16? 5,6,7,9,10,11,14,15: that's…

Snap & solve any problem in the app
Get step-by-step solutions on Sovi AI
Photo-based solutions with guided steps
Explore more problems and detailed explanations
16