QUESTION IMAGE
Question
gebra i b-cr
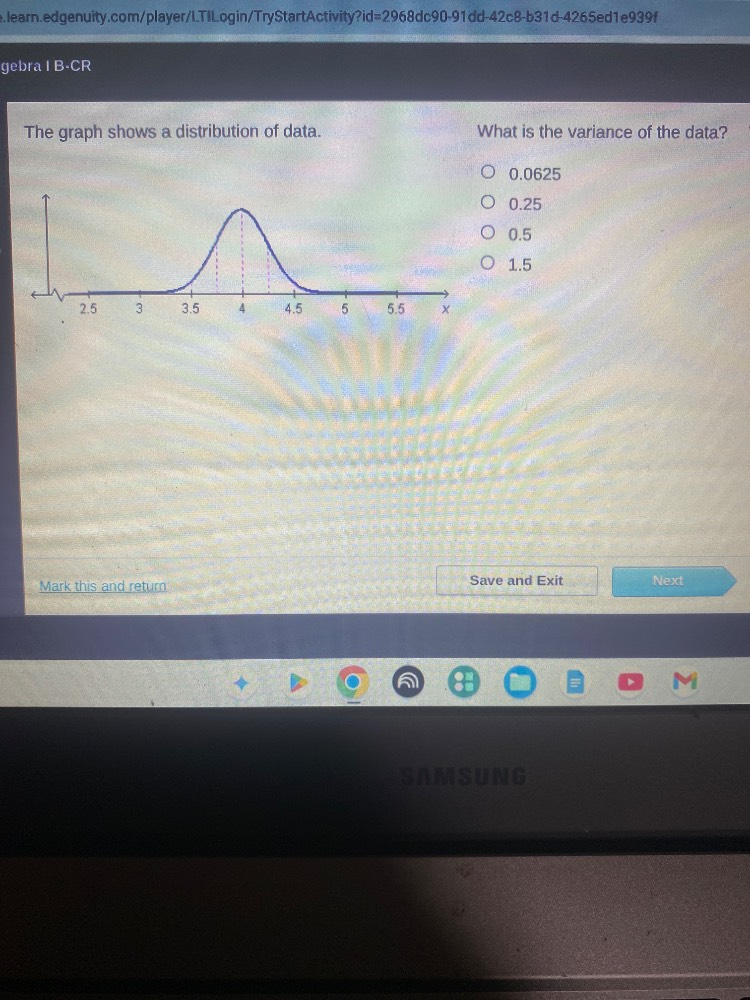
the graph shows a distribution of data.
what is the variance of the data?
0.0625
0.25
0.5
1.5
Step1: Identify mean and standard deviation
For a normal distribution, the mean $\mu$ is the center (4), and the standard deviation $\sigma$ is the distance from mean to the first inflection point: $\sigma = 4 - 3.5 = 0.5$.
Step2: Calculate variance
Variance is the square of standard deviation: $\text{Variance} = \sigma^2$
$\text{Variance} = 0.5^2 = 0.25$

Snap & solve any problem in the app
Get step-by-step solutions on Sovi AI
Photo-based solutions with guided steps
Explore more problems and detailed explanations
0.25