QUESTION IMAGE
Question
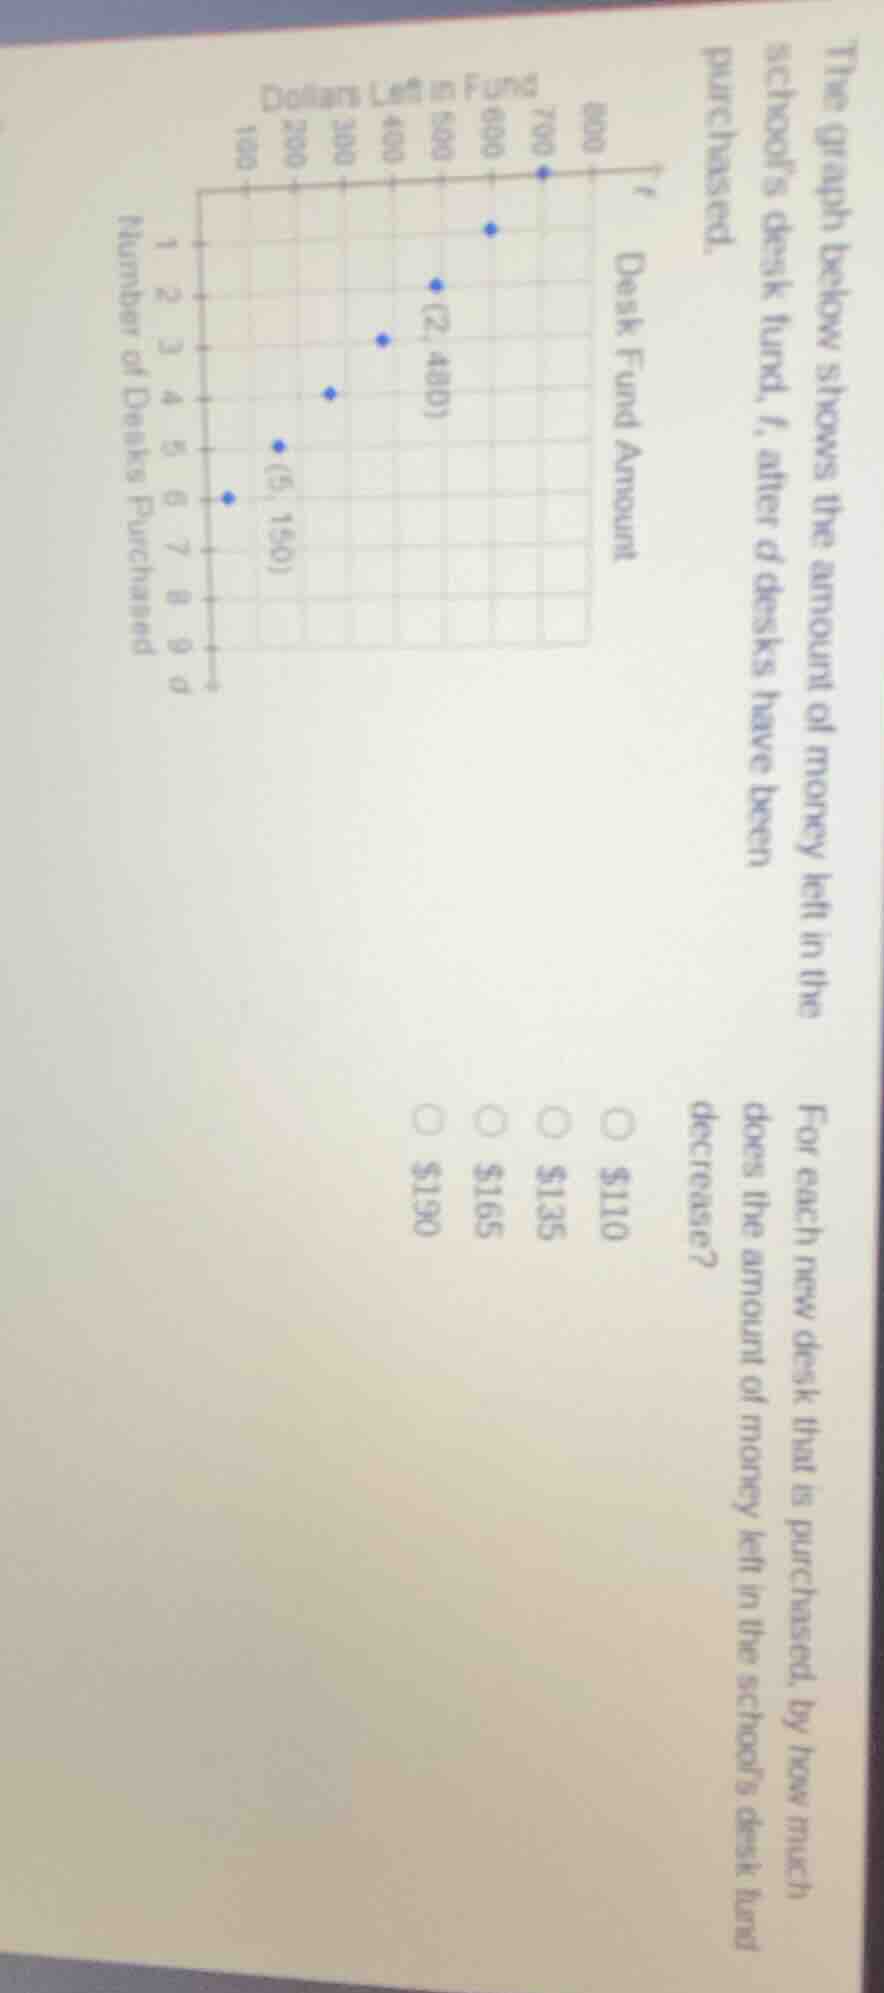
the graph below shows the amount of money left in the school’s desk fund, $f$, after $d$ desks have been purchased.
for each new desk that is purchased, by how much does the amount of money left in the school’s desk fund decrease?
$110
$135
$165
$190
Step1: Identify two points
We have two points from the graph: \((d_1, f_1) = (2, 480)\) and \((d_2, f_2) = (5, 150)\).
Step2: Calculate the slope (rate of decrease)
The formula for slope (rate of change) is \(m=\frac{f_2 - f_1}{d_2 - d_1}\).
Substitute the values: \(m=\frac{150 - 480}{5 - 2}=\frac{- 330}{3}=- 110\). The negative sign indicates a decrease, and the magnitude is 110.

Snap & solve any problem in the app
Get step-by-step solutions on Sovi AI
Photo-based solutions with guided steps
Explore more problems and detailed explanations
\$110