QUESTION IMAGE
Question
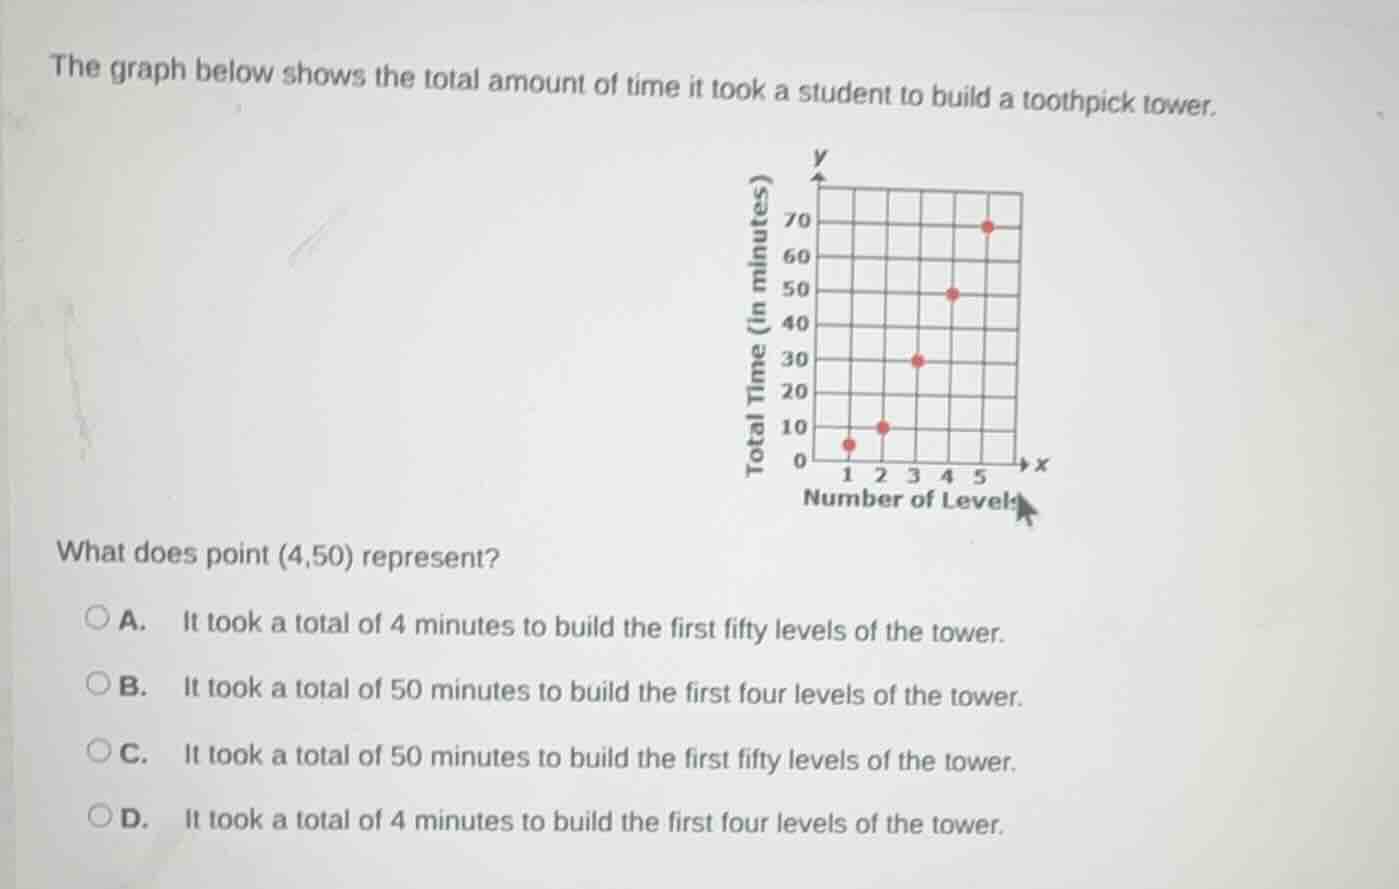
the graph below shows the total amount of time it took a student to build a toothpick tower.
graph with x-axis labeled number of levels and y-axis labeled total time (in minutes). points are at (1, ~5), (2, ~10), (3, ~30), (4, ~50), (5, ~70).
what does point (4,50) represent?
a. it took a total of 4 minutes to build the first fifty levels of the tower.
b. it took a total of 50 minutes to build the first four levels of the tower.
c. it took a total of 50 minutes to build the first fifty levels of the tower.
d. it took a total of 4 minutes to build the first four levels of the tower.
First, identify the axes: the x-axis is "Number of Levels" and the y-axis is "Total Time (in minutes)". For a coordinate point (x,y), the x-value corresponds to the number of levels, and the y-value corresponds to the total time taken. For (4,50), x=4 means 4 levels, y=50 means 50 minutes.

Snap & solve any problem in the app
Get step-by-step solutions on Sovi AI
Photo-based solutions with guided steps
Explore more problems and detailed explanations
B. It took a total of 50 minutes to build the first four levels of the tower.